")
")
| Issue |
Radioprotection
Volume 52, Number 3, July-September 2017
|
|
|---|---|---|
| Page(s) | 171 - 176 | |
| DOI | https://doi.org/10.1051/radiopro/2017016 | |
| Published online | 26 June 2017 | |
Article
Doses from Cs-137 and Sr-90 to Czech population due to milk consumption
1
NRPI, branch Ostrava,
Syllabova
21,
703 00
Ostrava 3, Czech Republic
2
NRPI,
Bartoškova
21,
140 00
Praha 4, Czech Republic
* Corresponding author: This email address is being protected from spambots. You need JavaScript enabled to view it.
Received:
3
June
2016
Accepted:
3
May
2017
Abstract
Activity concentrations of 137Cs and 90Sr in milk have been monitored in the Czech Republic on a long-term basis. The annual geometric means of 137Cs activity concentrations in milk range from 12 Bq.L−1 in 1986 to 0.02 Bq.L−1 in 2014. The annual geometric means of 90Sr activity concentrations range from 0.69 Bq.L−1 in 1965 to 0.02 Bq.L−1 in 2014. The values of effective and environmental half-lives in milk were calculated for both radionuclides from the annual geometric means and their temporal trends. Doses from both radionuclides due to milk ingestion were estimated.
Key words: 137Cs caesium / 90Sr strontium / milk / dose
© EDP Sciences 2017
1 Introduction
The content of radionuclides in milk has been a subject of long-term monitoring in the Czech Republic. The most important artificial radionuclides in the food chain are 137Cs and 90Sr. Both have long physical half-life, both are chemical analogues of biogenic elements and both are transferred to milk. Caesium-137 with a half-life of 30.1 years, is an analogue of potassium depositing in muscular tissue and its behaviour is similar to potassium in plants and animals. Strontium has similar half-life, 28.8 years and behaves very much like calcium. A large portion of strontium will accumulate in bones and like calcium it transfers to milk. Since the Sr uptake by the human body from milk is an important pathway for radiostrontium incorporation, milk is a good indicator of 90Sr content in human diet.
137Cs and 90Sr in the environment of the Czech Republic came from two sources. The first source has been relatively homogeneous surface contamination caused by the nuclear weapon tests especially in the 1960s. It used to reach (UNSCEAR, 1982) 5 kBq.m−2 for 137Cs and 3.23 kBq.m−2 for 90Sr on the north hemisphere between 40°–50° N. The second source was surface contamination caused by the fallout after the Chernobyl nuclear power plant accident. It spread inhomogeneously on the Czech Republic territory due to the variedly intensive rainfalls during the passage of the contaminated air over the territory. After the Chernobyl accident maximal surface activities of 137Cs in some areas reached up to 100 kBq.m−2; the average value was estimated (IHE, 1986; UNSCEAR, 1993; De Cort et al., 1998) to be between 4 and 7 kBq.m−2. Concerning 90Sr, the activity increment in Central Europe caused by the Chernobyl accident was several times lower (Irlweck and Khademi, 1996; De Cort et al., 1998) than that of 137Cs.
As a result of the Chernobyl accident in 1986 the activity concentrations of 137Cs in milk in many countries increased markedly by two to three orders from less than a tenth of Bq.L−1 to units up to tens of Bq.L−1. The activity concentrations decreased relatively quickly during approximately a decade back to the pre-Chernobyl value. The decrease in the following years was only very slow (Grabowski et al., 2002; Varga et al., 2006; STUK, 2008; JRC, 2009). The development of 137Cs activity concentrations in milk in the Czech Republic in the first years after the Chernobyl accident is described in several publications (Drábová et al., 1988, 1990; Kameník et al., 2009). The comprehensive results of milk and powdered milk monitoring till 2014 are presented in this paper.
The following values of 90Sr activity concentrations in milk were detected in several countries neighbouring the Czech Republic: Poland − 0.3 Bq.L−1 in 1974 and 0.2 Bq.L−1 in 1975; East Germany − between 1974 and 1976 the values were in the interval (0.2–0.1) Bq.L−1; West Germany − the values (UNSCEAR, 1982) between 1975 and 1980 were in the interval (0.3–0.1) Bq.L−1. In Austria 0.078 Bq.L−1 was found (Mück et al., 1990) in 1997. Already in the period of the nuclear weapon tests the content of 90Sr in the Czech Republic environment had been monitored (Březík et al., 1980; Radioaktivita, 1990).
2 Materials and methods
2.1 Sampling of milk
Samples of raw, processed − pasteurised, sterilised and powdered milk come in the Radiation monitoring network (RMN) from the retail network or producers (mostly dairies) for 137Cs and 90Sr determination. The aim is to achieve the most widespread and homogeneous monitoring of the Czech Republic territory and consequently to detect representative activities, which allow to estimate the population doses. Since the Chernobyl accident till the present time the sampling has been optimized as activities of radionuclides kept decreasing. Several tens of liquid and powdered milk samples from virtually homogeneously spread sites are collected in the Czech Republic per year.
Altogether 8107 samples of milk were collected within RMN since the Chernobyl accident till the end of 2014 for determination of 137Cs. Out of the number there were 5350 liquid milk samples and 2757 powdered milk samples. Besides the National Radiation Protection Institute, the State Veterinary Institute has been participating in the milk sampling and 137Cs evaluation since 2004. The results are collected in the common database RMN.
For the period 1965 – spring 1986 annual geometric means of 90Sr activity are included in this study. Data on 90Sr activity concentrations in milk from dairy (Praha − Radlice) since 1965 till 1995 are available. Samples for 90Sr determination were collected systematically only in that dairy till 1986, afterwards the sampling network was enlarged markedly. Results from seven dairies in Northern Moravia and several others in Prague and its vicinity are used in this paper. Some of the dairies have been closed and the activity concentration of 90Sr in liquid milk decreased, therefore the number of surveyed dairies was reduced. The dairy sampling was conducted in Prague till 2002, followed by liquid milk sampling from retail shops until now. In Northern Moravia one dairy: Ostrava − Martinov, has been surveyed since 1988–till present, with quarterly sampling. Three hundred and sixty four data on liquid milk have been obtained since 1986.
Since activity concentrations of 90Sr in liquid milk were decreasing, determinations of its activity concentrations in powdered milk were initiated. The samples have been collected from one dairy since 1999 and from retail network in seven regions of the Czech Republic since 2006, currently 2 times a year. Altogether 173 powdered milk samples have been analysed since 1999.
2.2 Caesium-137 detection with gamma-ray spectrometry
Caesium-137 is detected using gamma-ray spectrometry, either with or without the sample pre-treatment. High purity germanium detectors of various efficiencies ranging from 10 to 150% were used. The efficiency calibration with gel calibration standards produced in the Czech Metrology Institute was used. In case of the difference between the measured sample density and calibration standard, correction to self-absorption was performed.
Activity of 137Cs in powdered milk samples, and, less often, in liquid milk samples, was measured without previous treatment in identical geometry in cylindrical containers of 0.2 L placed around or on the detector. In samples of liquid milk with low activity concentration, 137Cs was separated before the counting with composite inorganic ion exchanger NiFC–PAN, produced (Šebesta et al., 1994) at the Czech Technical University and after drying measured in Petri dishes of 55 mm diameter. To calculate statistical characteristics, 137Cs activity of powdered milk (in Bq.kg−1) was converted into activity concentrations of liquid milk (in Bq.L−1) by dividing by the following factors: 11.2 L.kg−1 (skimmed milk with lower than 0.5% fat on dry basis), 9.8 L.kg−1 (semi skimmed milk with 14% fat) and 8.2 or 8.4 L.kg−1 (whole milk with 26 and 28% fat) (Kněz, 1974). In case there was no fat indication on the given sample of powdered milk, the conversion factor for semi skimmed milk was used.
2.3 Radiochemical determination of 90Sr
Activity of 90Sr in liquid and powdered milk has been monitored exploiting a radiochemical method based on the U.S. Department of Energy, Environmental Measurements Laboratory method Sr-03-RC (HASL 300, 2015). Contrary to the original method strontium was not separated from calcium. A milk sample was ashed and the ash dissolved in hydrochloric acid. First, strontium and calcium were concentrated by oxalate precipitation. Radium, lead and barium were removed with barium chromate precipitation. Traces of other fission products were scavenged with iron hydroxide. After the 90Sr + 90Y equilibrium has been attained, yttrium was precipitated as the hydroxide and converted to the oxalate for counting on a low-background gas-flow proportional beta counter. The source was repeatedly measured, typically for a week to follow the decrease in 90Y activity. Activity of 90Sr was calculated from the measured data and the time of 90Y ingrowth. Strontium yield was determined with 85Sr tracer by counting in a gamma well detector. The separation yield of Y was determined by complexometric titration. Efficiency of the proportional counter for 90Y was determined by counting 90Y separated from a standard solution the same way as in sample analysis.
Various types of low-background alpha-beta instruments with proportional detectors were being used in the whole period. All the chemicals used in the analyses were of analytical grade.
When liquid milk was used, samples from 2 to 3.5 L were taken and divided into two parallel sub-samples. Tracer 85Sr was added directly to the milk. When powdered milk was used, typically samples of 0.4 kg were taken for the analysis and tracer 85Sr was added to the ash. For powdered milk the value of activity in the powdered milk was recalculated for the activity concentration in native state using factor of 9.8 L.kg−1.
2.4 Statistical data processing
When processing the results, statistical characteristics of the individual data sets for 137Cs and 90Sr activities in milk were calculated from the individual values from all the sampling locations. Arithmetic mean (AM), geometric mean (GM) and geometric standard deviation (GSD) were estimated using programme R and a set of statistical programmes (Lee, 2009; R Development Core Team, 2011) NADA, which allow to evaluate data sets containing lower than minimum significant activity (MSA) values (Currie, 1968) and create their model substitutes. The calculations were based on the assumption of a log-normal distribution of the detected activities, while the MSA values were substituted with the model values, to comply with the assumption of the data log-normality as much as possible. The log-normality data compliance was verified by projection in quantile plots.
2.5 Calculation of half-lives and doses
Generating a best fit of time curve from radionuclide activity values in the matrix enables determination of effective and environmental half-lives of a given radionuclide in the given matrix. Effective half-life TEF characterizes a decrease in content caused by all processes in progress in a natural ecosystem in the given period and it is determined by equation (1):
 (1)
in which λEF means effective rate of loss. Environmental half-life TEN characterizes a decrease in a radionuclide activity caused by all processes being in progress in a natural ecosystem except for radioactive decay. Environmental half-life TEN can be expressed by equation (2):
(1)
in which λEF means effective rate of loss. Environmental half-life TEN characterizes a decrease in a radionuclide activity caused by all processes being in progress in a natural ecosystem except for radioactive decay. Environmental half-life TEN can be expressed by equation (2):
 (2)in which TP is physical half-life of the given radionuclide, while it is always valid, that TP > TEF.
Logarithmic plots of all the geometric means were created for each radionuclide. The activity time courses of both radionuclides show different characters in various periods. The whole observed intervals were thus divided into segments characterized by straight data development as presented in the logarithmic plot. The location of the break points for 137Cs was determined by iteration method (Muggeo, 2003). The fits and resulting equations in the individual sections were obtained by piecewise linear continuous regression implemented in the package “segmented” of the programme R (Muggeo, 2008).
For 90Sr, at first the whole monitored interval was also analysed with the help of the above mentioned iteration method. It suggested the break points in the years 1974 and 1991. As especially the second suggested break did not correspond to the events important from the point of view of the radionuclide release into the environment, a different way of evaluation was chosen. The new break points at 1974 and 1986 were determined. Linear regression in Excel application was used to obtain the best fits for the chosen segments. Values of λEF (actually a slope of the best fit lines) and their deviations were calculated for the individual segments. According to equation (1) effective and according to equation (2) environmental half-lives were calculated for both radionuclides in the given periods.
Annual committed effective dose, E, was estimated using equation (3):
 (3)
in which GM(c) means geometric mean of activity concentration, CR consumption rate of raw milk (in equivalent of milk products) and hing dose coefficient for intake by ingestion.
(3)
in which GM(c) means geometric mean of activity concentration, CR consumption rate of raw milk (in equivalent of milk products) and hing dose coefficient for intake by ingestion.
3 Results and discussion
3.1 Caesium-137
Since 1986 the number of annually analysed samples was gradually reduced from the original 3046 to 66 in 2014. In the same time interval the number of model (below MSA) values increased from 5% to 50%. As for the individual values of 137Cs activity concentrations the maximum value in 1986 in one of the sampling locations 560 Bq.L−1 was found. In 2014 no activity concentration exceeded 0.3 Bq.L−1.
Annual GMs of 137Cs activity concentrations in milk are shown in Figure 1. Time course of 137Cs activity concentrations in milk starts with the GM of 12 Bq.L−1 in 1986. Rapid decrease in the first years after the Chernobyl accident was approximately from 1992 followed with almost constant development of activity concentrations on the level of hundredths of Bq.L−1 and the minimum value is 0.02 Bq.L−1 in 2014. The GSDs for annual GMs for the whole interval 1986–2014 were about from 2 to 4.
The values of 137Cs activity concentrations were used to generate a best fit curve starting at the day of the Chernobyl accident (26 April 1986). Using programme R, the first break point on the curve to (2.6 ± 0.1) y and the second break point (6.4 ± 0.3) y after the accident was determined. As the first and the second segments are very short, with a small number of the annual GMs, individual measured activities and model values to find the fits for all three segments were used.
The best fit equations of the curves and effective (TEF) and environmental (TEN) half-lives calculated from them are presented in Table 1. The activity concentrations were decreasing from 1986 to 1988 with the TEF = 0.4 y and TEN = 0.4 y (λEF= [1.80 ± 0.30] y−1). Between 1989 and 1992 the decrease slowed and both half-lives increased to TEF = 1.7 y and TEN = 1.8 y (λEF = [0.42 ± 0.05] y−1). Since 1992 the level of 137Cs activity concentration in milk has been stable. The effective half-life has not been calculated because it does not comply with the condition TP > TEF. Estimation of the coefficient λEF is in this case loaded with high uncertainty (approximately 50%, λEF = [0.006 ± 0.003] y−1) caused by its low level and a relatively short observation interval.
For comparison, in Austria the environmental half-life values for 137Cs in milk were found to be 4.5 y − 15 y in the period 1988–2007 and 4.3 y − 29.9 y for the shorter period 1993–2007. Both half-lives markedly depend (Lettner et al., 2009) on the altitude where cows live. According to other sources the reduction of 137Cs content in dairy milk in four variedly contaminated areas in Finland was slower than in the Czech Republic and different in unevenly contaminated areas. The environmental half-life values there were estimated (Kostiainen, 2005) to be 1.8 y − 3.2 y in the period 1987–1989 and 4.7 y − 8.7 y for the period 1990–2003. For milk sampled in 1987–1993 from ten farms in central Sweden the effective half-life was in the interval 0.8 y − 2 y (Gunnel et al., 1995). Only a rough comparison of the values found by us and the values published is possible because individual papers differ in the survey period length and the number of break points on the best fit curves.
 |
Fig. 1 The annual geometric means of 137Cs activity concentrations in milk in the whole Czech Republic. |
Regression equation of the curves and the values of the effective (TEF) and environmental (TEN) half-lives of 137Cs in milk in the Czech Republic between 1986 and 2014 calculated from them.
3.2 Strontium-90
Since 1965 altogether 537 milk samples were analysed in the whole Czech Republic. Out of that 19% were lower than the MSA. The number of samples increased after the Chernobyl accident in 1986, in the period 1986–1996 approximately 40 milk samples were analysed annually. No value was under MSA in this period. Since 1997 the number of samples has been optimised and gradually reduced to 14 samples per year in 2014. Since 2008 some single and later most values have been under MSA, altogether 64% of values in 2014.
Calculated annual geometric means of 90Sr activity concentrations in milk fitted with a curve are presented in Figure 2. The highest activity concentration of 90Sr in milk comes from 1965 and equals to 0.69 Bq.L−1, in the following years first a sharp and from 1971 a slow decrease were observed. It is evident from the plot (Fig. 2) that 90Sr activity concentration in milk promptly decreased after the atmospheric nuclear test moratorium (UNSCEAR, 1982) in 1963 (France signed in 1974, China did not sign). The decrease was caused by lower release of 90Sr into the environment and its consequent transfer to the dairy milk cows and their milk. In 1986 due to the Chernobyl accident 90Sr was further released into the environment, which resulted in an abrupt increase in GM values from 0.06 Bq.L−1 to 0.10 Bq.L−1 in the Czech Republic. As a consequence, the number of sampling sites and milk samplings were extended. Calculated GMs in the following years were thus loaded with higher uncertainty due to larger dispersion of the detected values. From the new maximum in 1986 the activity concentrations were decreasing and after approximately 10 years they reached the values observed before the Chernobyl accident, approximately 0.06 Bq.L−1. Such a time course corresponds well to the activity concentrations found in the neighbouring states, mentioned earlier in the first chapter.
For 90Sr, programme R suggested the break points in (9.3 ± 0.9) y and in (26.7 ± 3.3) y from the beginning in 1965, hence in the years 1974 and 1991. Comparing the suggestion of the programme with the course of events controlling 90Sr content in the environment, it was found that the programme could not work appropriately with the abrupt, yet small increase in 1986 due to the Chernobyl accident. Therefore, the years 1974 (connection with the atmospheric nuclear test moratorium) and 1986 (the Chernobyl accident) were selected as the break points for the curves and further fits were conducted manually via linear regression in Microsoft Excel. The resulting regression equations of the curves and TEF and TEN calculated based on them are presented in Table 2.
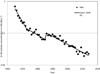 |
Fig. 2 The annual geometric means of 90Sr activity concentrations in milk in the Czech Republic. |
Regression equation of the curves and the values of the effective (TEF) and environmental (TEN) half-lives of 90Sr in milk between 1965–2013.
3.3 Estimation of doses
The consumption rate of milk and milk products in terms of milk equivalent in Czech Republic is known (ČSÚ, 2012, 2014) for years 1965–2014, with average about 218 L. (year.person)−1, minimal value 179.3 L. (year.person)−1 and maximal value 252.0 L. (year.person)−1.
The data for 137Cs content in milk before Chernobyl accident do not exist and only rough estimation is possible based on UNSCEAR data (UNSCEAR, 1977). Maximal GM for 137Cs activity concentration was determined in the year 1986. For adult population with dose coefficient (ICRP Publication 119, 2012) 1.3.10−8 Sv.Bq−1 annual committed effective dose 26 μSv.year−1 was calculated using equation (3). Since then, annual doses decreased stepwise to about 0.065 μSv.year−1.
Due to maximal GM for 90Sr activity concentration in milk, 0.69 Bq.L−1, the highest annual dose from 90Sr ingestion of milk was in the year 1965, namely 4.2 μSv.year−1 for adult population (dose coefficient (ICRP Publication 119, 2012) 2.8.10−8 Sv.Bq−1). At present it is less than 0.24 μSv.year−1.
As the contamination of Czech territory after the Chernobyl accident was not homogeneous and there are also groups of people with higher consumption rate of milk and milk products, individual doses could also be higher up to one order of magnitude. Doses to small children were also higher. Apart of this, it has to be born in mind that after the Chernobyl accident, dominant contributors to ingestion doses from milk were radioisotopes of iodine and also 134Cs contributed significantly.
4 Conclusions
The activity concentration mean of 137Cs in milk in the Czech Republic decreased from 12 Bq.L−1 below 0.5 Bq.L−1 during three years after the Chernobyl accident and since then it has remained on very low level. Since 1990 GM of activity concentrations of 137Cs in milk appear under the level of 0.1 Bq.L−1 and since 1992 the content of 137Cs in the forage components and hence in milk is stable except for the decrease caused by radioactive decay.
Activity concentrations of 90Sr in milk have dropped from initial tenths Bq.L−1 to hardly detectable values during 1965–2014. Environmental and effective half-lives were calculated for the periods 1965–1973, 1974–1985 and 1986–2014, which are essential from the point of view of 90Sr contamination. All TEF and TEN are lower than the physical half-life of 90Sr, so the radionuclide disappears from milk faster than due to its physical decay. The effective and environmental half-lives are very close in the second and the third monitoring periods − the possible explanation is a low share of 90Sr contained in the environment in the Czech Republic due to the Chernobyl accident, compared to the whole amount of 90Sr.
The tests of nuclear weapon can be considered the largest source of man‑made radionuclides in the environment in the Czech Republic.
The annual doses from ingestion of 137Cs and 90Sr are small. However, knowledge of the time course of activity of long-lived radionuclides in milk is important from the view of possible increases following irregular releases of radionuclides into environment.
Acknowledgement
This work was supported by Project of Ministry of Interior of the Czech Republic MV-25972-39/OBVV- 2010. We acknowledge the State Office for Nuclear Safety for the possibility to exploit the data obtained within the frame of the Radiation Monitoring Network.
References
- Březík Z, Březíková D, Kunz E. 1980. Vývoj zátěže obyvatelstva Sr-90 z radioaktivního spadu. In: Vývoj obsahu 90Sr v potravinách v ČSR (Závěrečná etapová zpráva), Díl 2. Praha: Institut hygieny a epidemiologie, in Czech. [Google Scholar]
- Currie LA. 1968. Limits for qualitative detection and quantitative determination. Anal. Chem. 40: 586–593. [Google Scholar]
- ČSÚ. 2012. Spotřeba potravin − 1948–2012. Available on: https://www.czso.cz/csu/czso/spotreba-potravin-1948-az-2012-n-hjw8eg93rj, in Czech. [Google Scholar]
- ČSÚ. 2014. Food Consumption − 2014. Available on: https://www.czso.cz/csu/czso/food-consumption-2014. [Google Scholar]
- De Cort M, et al. 1998. Atlas of cesium deposition on Europe after the Chernobyl accident. Brussels-Luxemburg: Office for Official Publications of the European Communities, ECSC-EEC-EAEC. [Google Scholar]
- Drábová D, Rulík P, Malátová I, Bučina I, Hölgye Z. 1988. Výsledky celostátního průzkumu obsahu umělých radionuklidů v mléce po černobylské havárii. Některé výsledky monitorování následků černobylské havárie v ČSSR. Praha: Ústřední informační středisko pro jaderný program, in Czech. [Google Scholar]
- Drábová D, Rulík P, Malátová I, Bučina I, Holgye Z. 1990. Monitoring of fallout radionuclides in milk in Czechoslovakia after the Chernobyl accident. In: Environmental contamination following a major nuclear accident, October 16–20, 1989, IAEA Vienna Proceedings of a Symp., Vol. 2., pp. 93–96. Vienna: IAEA. [Google Scholar]
- Grabowski D, Kurowski W, Muszyński W, Rubel B, Smagała G, Świętochowska J. 2002. Radioactivity of the environment and food in Poland in 2000–2001. Report of CLOR 2000–2001. Warsaw: Central Laboratory for Radiological Protection, 76. [Google Scholar]
- Gunnel K, Johanson KJ, Bertilsson J. 1995. Transfer of 137Cs to cow's milk: investigations on dairy farms in Sweden. J. Environ. Radioact. 28(1): l–15. [Google Scholar]
- HASL 300. 2015. 28th Edition. EML (1997). Available on: https://www.orau.org/ptp/PTP%20Library/library/DOE/eml/hasl300/analyticalchem.pdf. [Google Scholar]
- ICRP Publication 119. 2012. Compendium of dose coefficients based on ICRP publication 60. Ann. ICRP 41(Suppl.). [Google Scholar]
- IHE. 1986. Report on radiation situation in CSSR after Chernobyl accident. Prague: IHE. [Google Scholar]
- Irlweck K, Khademi B. 1996. Radionuclide ratios of 90Sr/137Cs and 239(240)Pu/137Cs in contaminated surface air after the Chernobyl accident in Austria. J. Radioanal. Nucl. Chem. 1: 79–85. [Google Scholar]
- JRC. 2009. Environmental radioactivity in the European Community 2004–2006. In: DG TREN: Nuclear energy, Radiation Protection (Luxembourg). European Commission, Joint Research Center–JRC, Institute for Environment and Sustainability, Ispra (Italy). [Google Scholar]
- Kameník J, Škrkal J, Rulík P. 2009. Long term monitoring of Cs-137 in foodstuffs in the Czech Republic. Appl. Radiat. Isot. 67(5): 974–977. [CrossRef] [PubMed] [Google Scholar]
- Kněz V. 1974. Diary Guide − Tables and calculations. 1. Ed. Praha: SNTL, in Czech. [Google Scholar]
- Kostiainen E. 2005. Ecological half-lives of 137Cs and 90Sr in dairy milk in regions with different soil types. Radioprotection 40(1): S391– S397. [EDP Sciences] [Google Scholar]
- Lee L. 2009. NADA: Nondetects and data analysis for environmental data, R package version 1, 5–2. CRAN.R-project, org/package=NADA. [Google Scholar]
- Lettner H, Hubmer A, Bossew P, Strebl F, Steinhäusler F. 2009. Effective and ecological half-lives of 137Cs in cow's milk in alpine agriculture. Radiat. Environ. Biophys. 48: 47–56. [CrossRef] [PubMed] [Google Scholar]
- Muggeo VMR. 2003. Estimating regression models with unknown break-points. Stat. Med. 22(19): 3055–3057. [CrossRef] [PubMed] [Google Scholar]
- Muggeo VMR. 2008. Segmented: an R package to fit regression models with broken-line relationships. R News 8(1): 20–25. [Google Scholar]
- Mück K, Streit S, Steger F, Mayr K, Karg V. 1990. Estimate of the dose due to 90Sr to the Austrian population after the Chernobyl accident. Health Phys. 38: 47–58. [Google Scholar]
- R Development Core Team. 2011. R. A language and environment for statistical computing. Available on: www.R-project.org. [Google Scholar]
- Radioaktivita. 1990. In: Životní prostředí České republiky (Vývoj a stav do konce roku 1989), pp. 183–199. Praha: Academia, in Czech. [Google Scholar]
- STUK. 2008. Surveillance of environmental radiation in Finland, Annual report 2007 (R. Mustonen, Ed.), STUK-B 91. Helsinki, p. 67. ISBN 978-952-478-380-4 (pdf). Available on: www.stuk.fi. [Google Scholar]
- Šebesta F, John J, Motl A. 1994. Separation and concentration of contaminants using inorganic-organic composite absorbers. In: Budapest'94 − 2nd Symposium and Exhibition on Environmental Contamination in Central and Eastern Europe, Proceedings, September 20–23, Budapest. [Google Scholar]
- UNSCEAR. 1977. Sources and effects of ionizing radiation. In: Report to the General Assembly, with annexes. United Nations, New York: UNSCEAR. [Google Scholar]
- UNSCEAR. 1982. Ionizing radiation: sources and biological effects. In: Report to the General Assembly, with annexes. United Nations, New York: UNSCEAR. [Google Scholar]
- UNSCEAR. 1993. Sources and effects of ionizing radiation. In: Report to the General Assembly, with annexes. United Nations, New York: UNSCEAR. [Google Scholar]
- Varga B, Tarján S, Süth M, Sas B. 2006. Radionuclide monitoring strategy for food-chain in Hungary. J. Environ. Radioact. 86: 1–11. [CrossRef] [EDP Sciences] [PubMed] [Google Scholar]
Cite this article as: Bartusková M, Škrkal J, Schlesingerová E, Bečková V, Malátová I. 2017. Doses from Cs-137 and Sr-90 to Czech population due to milk consumption. Radioprotection 52(3): 171–176
All Tables
Regression equation of the curves and the values of the effective (TEF) and environmental (TEN) half-lives of 137Cs in milk in the Czech Republic between 1986 and 2014 calculated from them.
Regression equation of the curves and the values of the effective (TEF) and environmental (TEN) half-lives of 90Sr in milk between 1965–2013.
All Figures
|
Fig. 1 The annual geometric means of 137Cs activity concentrations in milk in the whole Czech Republic. |
| In the text | |
|
Fig. 2 The annual geometric means of 90Sr activity concentrations in milk in the Czech Republic. |
| In the text | |
Current usage metrics show cumulative count of Article Views (full-text article views including HTML views, PDF and ePub downloads, according to the available data) and Abstracts Views on Vision4Press platform.
Data correspond to usage on the plateform after 2015. The current usage metrics is available 48-96 hours after online publication and is updated daily on week days.
Initial download of the metrics may take a while.