")
")
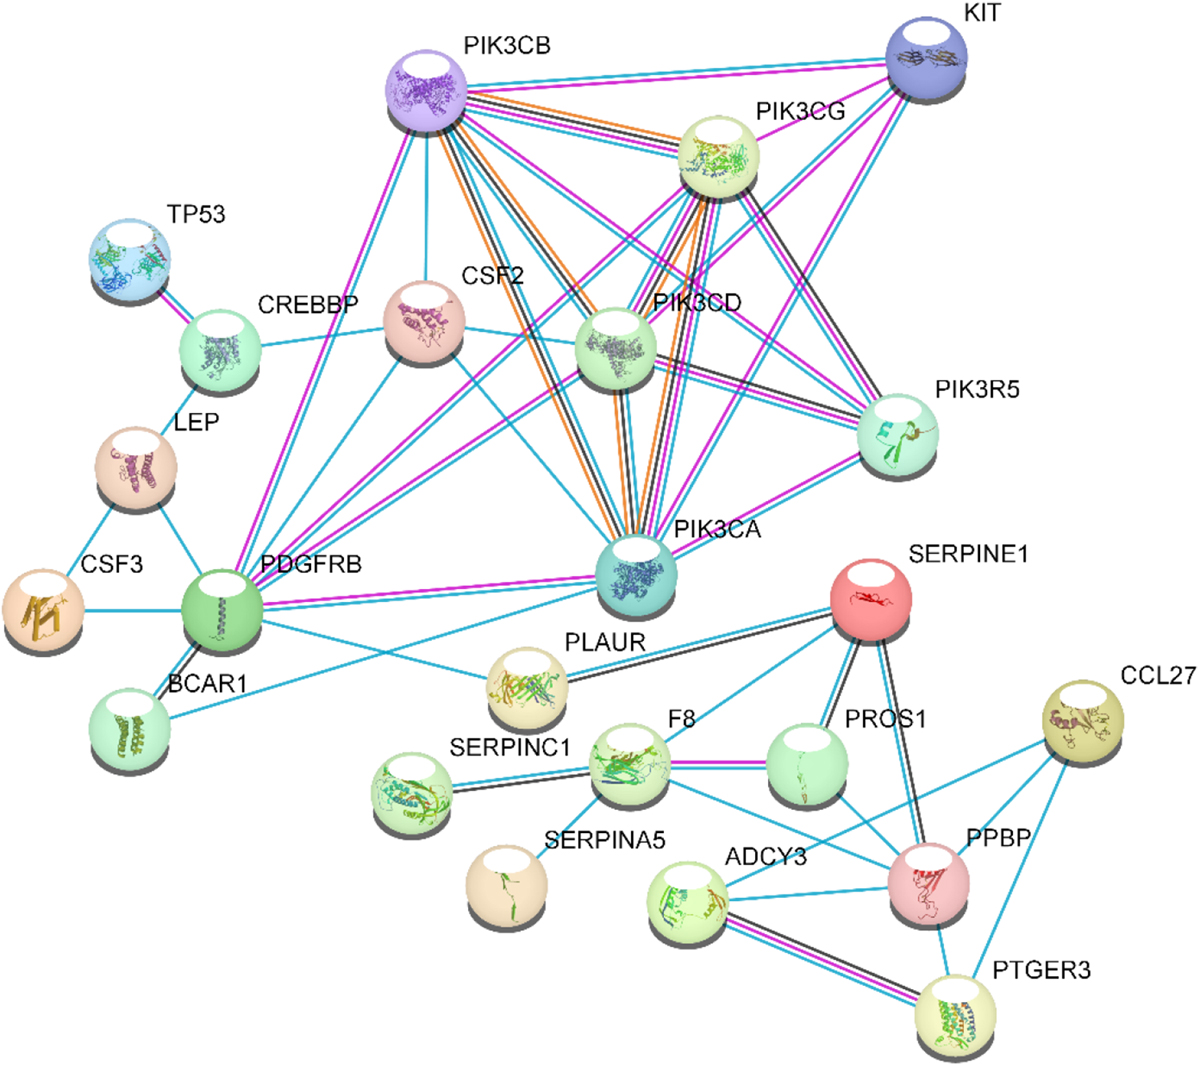
Fig. 2
Download original image
High-confidence protein-protein interaction network of the 23 target genes. Connecting line colors indicate the type of information used to infer the interaction with a confidence interval set at 90%. “Sky blue lines” represents data from curated databases; “Purple lines” represents experimental determined; “black lines”represents co-expression; “Orange lines” represents protein homology.
Current usage metrics show cumulative count of Article Views (full-text article views including HTML views, PDF and ePub downloads, according to the available data) and Abstracts Views on Vision4Press platform.
Data correspond to usage on the plateform after 2015. The current usage metrics is available 48-96 hours after online publication and is updated daily on week days.
Initial download of the metrics may take a while.