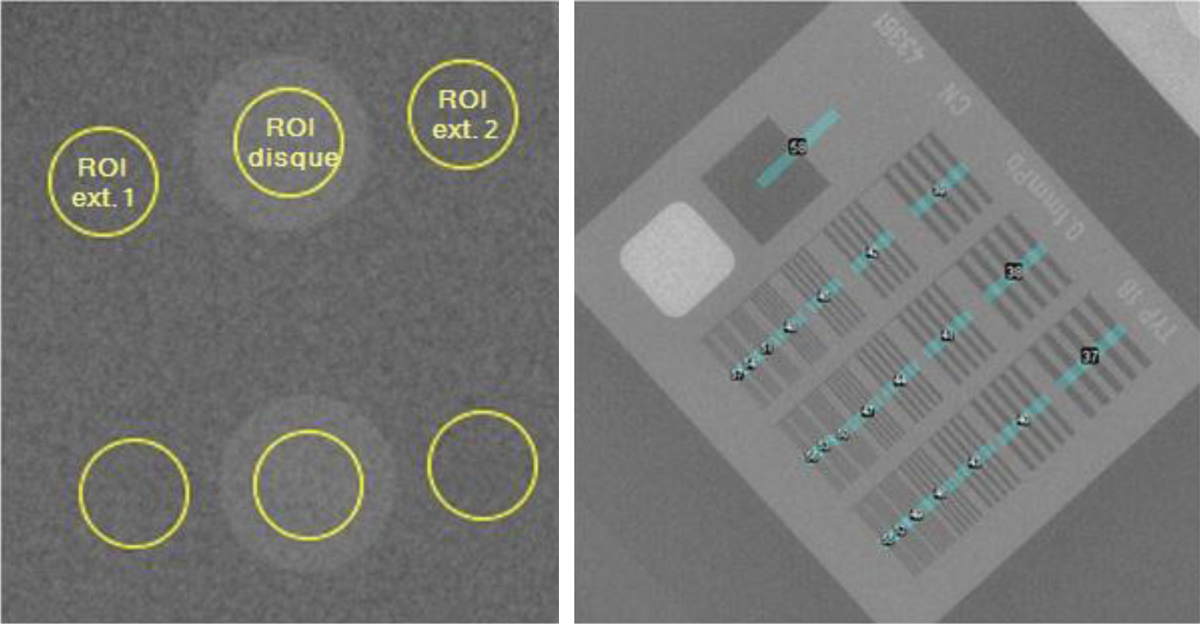
Fig. 2

Download original image
Illustration des positionnements des ROI pour l’évaluation du bas contraste (à gauche) et des tracés de profils réalisés au centre de chaque groupe de paires de lignes pour l’évaluation de la résolution spatiale (à droite).
Illustration of ROI positions for low contrast evaluation (left) and profile plots made in the center of each group of line pairs for spatial resolution evaluation (right).
Current usage metrics show cumulative count of Article Views (full-text article views including HTML views, PDF and ePub downloads, according to the available data) and Abstracts Views on Vision4Press platform.
Data correspond to usage on the plateform after 2015. The current usage metrics is available 48-96 hours after online publication and is updated daily on week days.
Initial download of the metrics may take a while.


