")
")
| Issue |
Radioprotection
Volume 60, Number 2, Avril-Juin 2025
|
|
|---|---|---|
| Page(s) | 134 - 143 | |
| DOI | https://doi.org/10.1051/radiopro/2024053 | |
| Published online | 13 juin 2025 | |
Article
Typical local DRL values for interventional cardiology procedures
1
Lebanese American University, Medical Center-Rizk Hospital, Beirut, Lebanon
2
Faculty of Public Health, Université La Sagesse, Beirut, Lebanon
3
Lebanese Atomic Energy Commission, National Council for Scientific Research, 11-8281 Beirut, Lebanon
* Corresponding author: Cette adresse e-mail est protégée contre les robots spammeurs. Vous devez activer le JavaScript pour la visualiser.
Received:
22
July
2024
Accepted:
11
November
2024
Abstract
This study aims to establish typical values for common interventional cardiology (IC) procedures performed at the Lebanese American University Medical Center-Rizk Hospital (LAUMC-RH).
Air kerma-area product (PKA), cumulative air kerma at patient entrance reference point (Ka,r), fluoroscopy time, and number of images were retrospectively collected for 950 IC procedures conducted from May 2022 to November 2023. Typical values were determined as the median value of the distribution of exposure parameters for coronary angiography (CA), percutaneous coronary intervention (PCI), CA + PCI and transcatheter aortic valve implantation (TAVI) procedures. These values were then compared to Lebanese national and international diagnostic reference levels (DRLs) to define future optimization steps, if need.
The typical values were 14, 41, 37 and 33 Gy.cm2 for PKA and 260, 877, 782 and 295 mGy for Ka,r concerning CA, PCI, CA+ PCI and TAVI procedures, respectively. Notably, these values were lower than the national DRLs and those reported in other countries. This suggests the implementation of effective radiation protection practices at LAUMC-RH.
This is the first study to establish typical values for common IC procedures performed at LAUMC-RH. Despite the favorable results, it is essential to emphasize the continued efforts required to optimize patient radiation exposure for the safety of both patients and staff.
Key words: Diagnostic reference level / patient radiation exposure / interventional cardiology procedures / patient dosimetry
© R. Ghosn et al., Published by EDP Sciences 2025
 This is an Open Access article distributed under the terms of the Creative Commons Attribution License (https://creativecommons.org/licenses/by/4.0), which permits unrestricted use, distribution, and reproduction in any medium, provided the original work is properly cited.
1 Introduction
Interventional cardiology (IC) procedures provide several advantages over traditional open-heart surgeries. These minimally invasive techniques involve smaller incisions or catheters, resulting in faster recovery times, reduced complications, and shorter hospital stays. Providing both diagnostic and therapeutic advantages in one session, IC allows for repeatable procedures, facilitating ongoing management and adjustments according to a patient’s evolving cardiovascular condition. Consequently, there is a substantial annual increase in the number of interventional procedures globally, as reported in the UNSCEAR 2020/2021 Report (UNSCEAR, 2022). The estimated annual total of about 24 million interventional radiology procedures represents an approximately six fold increase from the 3.6 million procedures documented in the UNSCEAR 2008 Report. The annual global average frequency has increased from 0.6 to 3.2 procedures per 1,000 population (UNSCEAR, 2010).
Meanwhile, the advancement in imaging equipment, medical devices and the introduction of new technologies have facilitated the performance of sophisticated IC procedures which may result in high radiation exposure for patients and occupationally exposed workers (Tsapaki et al., 2009; Balter et al., 2017). IC has been associated with high patient skin doses, reaching up to a few Gray, posing a significant risk of tissue reactions (IAEA, 1996; ICRP, 2000; Valentin, 2000 ICRP, 2000; Balter et al., 2010; ICRP, 2012). Therefore, it is crucial to ensure that the patient radiation exposure in IC suites is kept as low as reasonably achievable (ALARA) for the safety of both patients and staff.
However, adhering to the optimization principle, keeping doses as low as possible while maintaining the desired image quality, poses a considerable challenge. In response, the International Commission on Radiological Protection (ICRP) recommends the establishment and utilization of diagnostic reference levels (DRLs) as part of a quality assurance program to optimize patient radiation exposure (ICRP, 2017). At a local level, patient dosimetry surveys need to be performed for IC procedures to determine typical doses/values. These typical doses/values should then be compared with the established DRLs for the State or region (IAEA, 2014). During the comparison process, if the typical dose/value for the facility exceeds the DRL or is substantially below the DRL and it is evident that the exposures are not producing images of diagnostic usefulness, a review of optimization of protection and safety for that particular procedure becomes necessary.
2 Literature review
DRLs for IC procedures have been established at national levels by several authors across multiple countries (Korir et al., 2013 ; Crowhurst et al., 2014; Rizk et al., 2019; Schegerer et al., 2019; Kataria et al., 2021; Kidoń et al., 2022; Srimahachota et al. et al., 2022; Ramanathan et al., 2023; Slave et al., 2023). Siiskonen et al. (2018) extended this establishment to a regional context. Yet DRLs for new techniques, such as transcatheter aortic valve implantation (TAVI), are still scarce and lacking in the literature (Ryckx et al., 2016; Järvinen et al., 2019; Kidoń et al., 2022). Moreover, it is crucial to note that typical values/doses should be determined independently by each health facility, rather than adopting them from other facilities. This is because these values reflect the specific equipment technology, level of complexity, and radiation protection practices unique to each health facility.
Thus, this study aims to establish typical values for IC procedures at the Lebanese American University Medical Center-Rizk Hospital (LAUMC-RH) and compare them with the Lebanese national and international DRLs to define future optimization steps, if need. Upon the completion of this study, recommendations will be provided that are crucial for implementing optimization measures at the Interventional Cardiology department − LAUMC-RH and other IC department to optimize patients’ and staff’ exposures.
3 Materials and methods
This study was conducted at the Interventional Cardiology department − LAUMC-RH. Approval for the study was obtained from the Lebanese American University Medical Center. Data were collected for various IC procedures including coronary angiography (CA), percutaneous coronary intervention (PCI), CA + PCI and TAVI. The procedures were performed using the Innova 2100 from GE HealthCare. Routine quality control tests are performed by GE HealthCare engineers for the equipment including verification of beam collimation and beam geometry, verification of different field sizes, patient entrance surface air kerma rate, image receptor entrance surface air kerma rate, kerma–area product meter accuracy, leakage radiation and scattered radiation.
The online dose indicators/exposure parameters are generated by the equipment for each examination, displaying air kerma-area product (PKA) in Gy cm2, cumulative air kerma at the patient entrance reference point (Ka,r) in mGy, fluoroscopy time (FT) in minutes.
3.1 Patient selection
This study exclusively enrolled adults patients aged more than 18 yr. A minimum of 50 patients was needed for each type of procedure (ICRP, 2017). According to the LAUMC-RH health research committee/ethics committee, informed consent was waived for studies aiming to anonymously review the medical records and exposure parameters of patients. This is because such studies involved no direct contact with the patients, the patients’ information will not be identifiable and will not affect their clinical care.
3.2 Data collection
Data were collected from the Interventional Cardiology department − LAUMCRH using an excel sheet. The sheet included details such as the date and the type of procedures performed and relevant patient demographics such as gender, age, height and weight. Additionally, online dose indicators/exposure parameters such as FT, Ka,r, PKA, total number of images (NoI) and total number of exposure (NoE), were recorded. The data collection period spanned from May 2022 to November 2023, providing a comprehensive timeframe for the study’s analysis.
3.3 Establishment of typical values and statistical analysis
The average, minimum, and maximum values of the exposure parameters were calculated. Additionally, the median and interquartile range (IQR) were computed for each type of procedure. The Kruskal-Wallis test was used to compare the median values of the exposure parameters among the four types of procedures CA, PCI, CA+PCI and TAVI. A p-value < 0.01 was considered as significant. All calculations were performed using the QI Macros software. The Kruskal-Wallis test was employed to compare the four independent procedures (CA, PCI, CA+PCI, and TAVI). This non-parametric test was chosen to evaluate differences in fluoroscopy time, radiation dose (Ka,r), dose-area product (PKA), and number of images (NoI) among the four unpaired procedure types.
Typical values were established for each type of procedure as the median value (2nd quartile) of the distribution of FT, Ka,r, PKA, NoE and NoI. These typical values were then compared with relevant National DRLs and those reported in the literature to assess the need for optimization.
In addition, linear regression analysis were conducted to study the correlations between the Body Mass Index (BMI), FT and NoI and the online dose indicators (PKA and Ka,r) during each type of procedure. This approach aimed to clarify factors that might affect the patient dose and will help in giving recommendations in order to improve the local practice.
4 Results
A dataset comprising 950 procedures was compiled, involving 700 patients who have undergone CA procedures, 100 patients who have undergone PCI, 100 patients who have undergone CA + PCI and 50 patients who have undergone TAVI.
The demographic characteristics of the sample population, including the mean, minimum and maximum values of age, height and weight corresponding to each type of IC procedures are presented in Table 1.
Table 2 presents the number of procedures along with the mean, minimum and maximum values of FT, Ka,r, PKA, NoE and NoI. Additionally, the table includes the median and interquartile range for each parameter and the results of the statistical analysis. In addition, the P-value results from the Kruskal-Wallis test for the four procedures (CA, PCI, CA+PCI, and TAVI) were also presented. For all variables compared (FT, Ka,r, PKA, NoE, NoI), the p-values are consistently <0.01. The ratios of the maximum to the minimum values of the FT for CA, PCI, CA+ PCI and TAVI were found to be equal to 32, 83, 15 and 4, respectively. Correspondingly, in terms of Ka,r, the ratios were 28, 28, 11 and 4 and in terms of PKA, the ratios were 36, 25, 8 and 7 (cf. Tab. 2).
Table 3 displays a comparison of typical values (e.g., median values) alongside with the National DRLs for each exposure parameter and values obtained from relevant literature.
Figures 1 through 6 depict the relationships between various parameters: BMI and PKA, BMI and Ka,r, FT and PKA, FT and Ka,r, NoI and PKA and NoI and Ka,r for CA, PCI, CA+ PCI and TAVI.
Figure 1 shows a scatter plot illustrating the relationship between BMI and PKA during cardiac procedures. The CA + PCI procedure demonstrates a positive slope, while both the PCI and CA procedures also show positive trends, with PCI appearing to have a slightly steeper slope than CA. TAVI, however, has the least pronounced slope, indicating a minimal increase in PKA with increasing BMI. Although a slight trend is observed across these procedures, the weak correlation suggests that BMI alone may not be a critical factor influencing radiation dose.
Figure 2 illustrates the linear relationship between Ka,r and BMI, showing a moderate positive trend in CA procedures, where increased BMI is associated with a higher radiation dose (Ka,r). For PCI, the association is weaker, suggesting that BMI has minimal impact on Ka,r, with other procedural factors playing a larger role. Similarly, in CA+PCI, BMI’s influence on radiation dose remains relatively small. In TAVI, the relationship between BMI and Ka,r is particularly weak, indicating that other procedural and patient factors are more significant.
Figure 3 shows a positive correlation between FT and Ka,r across all procedures, with scatter points trending upwards as FT increases. TAVI has the steepest slope, indicating a stronger increase in radiation dose with longer fluoroscopy times. CA+PCI and PCI also show significant increases but to a lesser extent, while CA has the shallowest slope, suggesting only modest increases in dose with FT. CA points are clustered at lower FT and Ka,r values, reflecting shorter procedures and lower radiation exposure, while TAVI shows a strong linear increase with fewer procedures. PCI and CA+PCI are more dispersed across a broad FT and Ka,r range, indicating greater variability in time and dose. Regression analysis further emphasizes that TAVI procedures require more radiation per minute of fluoroscopy than other procedures, with CA showing the lowest radiation exposure per minute, while PCI and CA+PCI fall in between, with dose increasing alongside fluoroscopy time.
Figure 4 illustrates a positive correlation between FT and PKA across all procedures, with scatter points trending upwards as FT increases. The PCI procedure has the steepest slope, indicating that it results in a larger increase in PKA per minute of fluoroscopy compared to other procedures. TAVI follows closely, showing a strong positive slope, while CA+PCI demonstrates a moderate increase in PKA with increasing FT, similar to TAVI. CA has the lowest slope, indicating a smaller increase in PKA with FT. The CA procedures cluster at the lower FT and PKA range, reflecting shorter procedures with lower radiation exposure. PCI and CA+PCI are more dispersed across a wide range of FT and PKA values, showing greater variation in time and dose. TAVI has fewer cases but a consistent correlation between FT and PKA, indicating a predictable increase in radiation with time.
Figure 5 shows the linear regression lines for each procedure, illustrating varying relationships between NoI and PKA. The CA + PCI procedure demonstrates a strong positive correlation, with a steep slope indicating a significant increase in PKA as the NoI rises. PCI also shows a positive trend but with a gentler slope than CA + PCI. TAVI presents a unique pattern with the least steep slope, suggesting a slower increase in PKA as NoI increases, while CA has a similar trend to TAVI but with a slightly more pronounced slope.
Figure 6 displays linear regression lines for each procedure, illustrating varying degrees of correlation between NoI and Ka,r. The CA+PCI procedure has the strongest correlation, with a steep slope, while PCI also shows a noticeable positive trend. CA exhibits a weaker correlation with a less steep dotted line, and TAVI presents a unique pattern, showing a positive relationship though less clearly defined compared to CA and PCI. These distinct linear relationships suggest that radiation exposure varies across procedures based on NoI, potentially reflecting differences in procedural complexity or technique.
Number (#) of procedures, mean (minimum − maximum) values of the age, height and weight for each type interventional cardiology procedure.
Number (#) of procedures, mean (minimum −maximum) and median (Q1–Q3) values of the distributions of each exposure parameter (FT, Ka,r, PKA, NoE and NoI) for interventional cardiology procedures. P-value results from the Kruskal-Wallis test for the four procedures (CA, PCI, CA+PCI, and TAVI) were also presented.
Comparison of typical values from this study with National DRLs and other international studies.
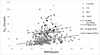 |
Fig. 1 The relationship between PKA (Gycm2) and BMI (Kg/m2) during a) CA procedures (R2 = 0.15), b) PCI procedures (R2 = 0.01), c) CA+ PCI procedures (R2 = 0.08) and d) TAVI procedures (R2 = 0.01). |
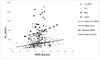 |
Fig. 2 The relationship between Ka,r (mGy) and BMI (Kg/m2) during a) CA procedures (R2 = 0.13), b) PCI procedures (R2 = 0.04), c) CA+ PCI procedures (R2 = 0.06) and TAVI procedures (R2 = 0.04). |
 |
Fig. 3 The relationship between Ka,r (mGy) and FT (min) during a) CA procedures (R2 = 0.37), b) PCI procedures (R2 = 0.64), c) CA+ PCI procedures (R2 = 0.63) and TAVI procedures (R2 = 0.69). |
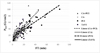 |
Fig. 4 The relationship between PKA (Gycm2) and FT (min) during a) CA procedures (R2 = 0.40), b) PCI procedures (R2 = 0.74), c) CA+ PCI procedures (R2 = 0.62) and TAVI procedures (R2 = 0.68). |
 |
Fig. 5 The relationship between PKA (Gycm2) and NoI during a) CA procedures (R2 = 0.48), b) PCI procedures (R2 = 0.41), c) CA+ PCI procedures (R2 = 0.43) and TAVI procedures (R2 = 0.46). |
 |
Fig. 6 The relationship between Ka,r (mGy) and NoI during a) CA procedures (R2 = 0.58), b) PCI procedures (R2 = 0.60), c) CA+ PCI procedures (R2 = 0.45) and TAVI procedures (R2 = 0.55). |
5 Discussion
The study was performed at one of the biggest private university hospital in Lebanon, where a total of 950 procedures were collected. The Kruskal-Wallis test was used to compare the median values of the exposure parameters among the four types of procedures CA, PCI, CA+PCI and TAVI. For all variables compared (FT, Ka,r, PKA, NoE, NoI), the p-values are consistently <0.01, suggesting that there are statistically significant differences across the four procedures. (cf. Tab. 2). As expected, the median values of FT, Ka,r, PKA, NoE and NoI were significantly higher in interventional (e.g., PCI, CA + PCI and TAVI) compared to diagnostic procedures (e.g., CA) (cf. Tab. 2). This indicates a robust and substantial statistical association between FT, Ka,r, PKA, NoE and NoI. The extremely low p-value suggests that the observed results are highly unlikely to have occurred by chance alone. Such a low p-value underscores the reliability and significance of the observed effect, reinforcing the validity of our study’s conclusions. This is also related to the longer fluoroscopy time required and the increased number of image acquisition, both of which are associated with the complexity of the procedures. This complexity is influenced by various factors, including patient anatomy, lesion characteristics, and disease severity (IAEA, 2009 ; Ruiz-Cruces et al., 2016).
Furthermore, within interventional procedures, PCI exhibited significantly higher median values for Ka,r (p= 10−3) and PKA (p=10−4) in comparison to CA + PCI (cf. Tab. 2). This can be attributed also to the complexity of the procedure and the utilization of additional imaging techniques like intravascular ultrasound (IVUS) or optical coherence tomography (OCT) during PCI cases (Januszek et al., 2022; Januszek et al., 2023; Januszek et al., 2023).
Various maximum to minimum ratios were identified for FT, Ka,r and PKA across the different procedures. These findings indicate that, even within the same type of procedures, various factors such as the complexity of individual cases, the techniques employed, and the expertise of the operator can influence patient exposures (Padovani et al., 2001).
Meanwhile, the typical values for PKA, Ka,r, and NoI in CA procedures were found to be lower than the national DRLs and those reported in the literature (cf. Tab. 3). However, the typical value for FT in CA procedures was similar to that reported by (Georges et al., 2017) (4 min) but higher than the national DRL (4 min compared to 3 min). For PCI and CA + PCI, the typical values for PKA and Ka,r were found to be lower than the national DRLs and literature values (cf. Tab. 3), except for the Ka,r reported in the study by (Kidoń et al., 2022) for PCI (782 mGy compared to 724 mGy). However, the typical values for FT differed between the two procedures. During CA + PCI, the FT value was higher than the literature values, while during PCI, the FT value was higher than literature values but lower than that reported in the study by (Korir et al., 2013) (20 min compared to 28 min). Furthermore, the FT values exceeded the national DRLs for both PCI and CA + PCI (20 vs. 11min and 16 vs. 12 min, respectively). Regarding the NoI, they were higher than the national DRLs for both PCI (952 vs. 616 images) and CA + PCI (988 vs. 822 images). The NoI in PCI was also higher than that reported by (Georges et al., 2017) (952 vs. 666 images), but lower than other studies in the literature. For TAVI procedures, the typical values for PKA, Ka,r and FT were found to be lower than the national DRLs and literature values (refer to Tab. 3). This could be explained by a lower use of cine during TAVI than during PCI, the techniques employed, and the expertise of the operator can influence patient exposures. However, this was not the case for the NoI. It is worth noting that although higher typical values were observed in this study in term of FT and NoI, this did not result in increased PKA or Ka,r values. This can be attributed to the lower dose rate employed during fluoroscopy and image acquisition at LAUMC-RH, indicating a cautious approach towards radiation exposure optimization.
Yet, the reduction of FT and the NoI during IC procedures can be achieved through several key factors which, in turn, can contribute to further minimizing patient exposure. First, the expertise and experience of operators play a crucial role, as skilled practitioners with experience in IC can perform procedures efficiently, leading to shorter FT and NoI. Secondly, effective procedural planning, which involves reviewing patient history and imaging studies, and developing a clear procedural strategy, helps streamline the procedure and minimizes the need for prolonged FT and NoI. Thirdly, efficient workflow and team coordination among cardiologists, nurses, and technologists contribute to smoother procedures, optimized catheter handling, and reduced FT and NoI. Fourthly, implementing procedural modifications, such as utilizing radial access, or using guide catheters with improved support and maneuverability, can enhance efficiency and reduce FT and NoI. Finally, operator awareness and radiation safety training through continuous education help increase awareness of radiation safety practices, leading to conscious efforts in reducing FT and NoI while prioritizing patient safety. By considering these factors, IC procedures can be performed more efficiently, reducing FT and NoI and patient exposure without compromising patient care (Padmanabhan et al., 2019; IAEA, 2022).
Unexpectedly, for CA, PCI, CA+PCI and TAVI, the correlations between the PKA and Ka,r and BMI values were poor (R2 < 0.4) indicating that there was no substantial increase in exposure parameters with increasing BMI (cf. Figs. 1 and 2). It is worth considering that various factors, such as the complexity of the procedure and procedural techniques, may have influenced this weak correlation observed in the study (Januszek et al., 2022; Januszek et al., 2023).
Since BMI did not significantly affect radiation exposure, this suggests that optimized radiation protocols should not over-adjust exposure parameters solely based on patient BMI. Instead, efforts should be focused on other controllable factors, such as imaging technique and equipment settings, to ensure consistent exposure across varying patient anatomies.
CA procedures show the strongest (though still weak) association with BMI, meaning that in larger patients, clinicians may need to be mindful of increased radiation exposure. In contrast, for PCI, CA+PCI, and TAVI, BMI alone is not a major factor driving increased radiation, so adjusting radiation protection strategies purely based on BMI may not be as critical.
The low R2 values across all procedures suggest that radiation exposure management should focus on multiple factors, not just patient BMI. Clinicians should remain aware of this during both planning and real-time adjustments in the procedure to optimize radiation safety.
Future studies should examine how BMI correlates with radiation exposure over time and assess whether a tailored, protocol-driven approach can reduce variability in patient outcomes and improve radiation safety.
Strong correlations (R2 > 0.6) were observed between the PKA and Ka,r and FT values for PCI, CA + PCI and TAVI indicating an increase in exposure parameters with longer FT. In contrast, the correlations between the PKA and Ka,r and FT values for CA was found to be poor (R2 < 0.4) (cf. Figs. 3 and 4). The difference in correlations can be attributed to several factors such as the nature of the procedures, source to image detector distance, source to patient distance and patient to image detector distance, the use of extreme angulations, use of collimation, varying patient anatomies, procedural variations, and different operator techniques. (Agarwal et al., 2014 Dawn Abbott J. 2014)
Reducing fluoroscopy time is critical for minimizing radiation exposure. An optimized protocol should include: Real-time dose monitoring, enhancing operator skills in minimizing FT, use of pulsed fluoroscopy, detailed pre-procedural planning to limit fluoroscopy time.
For CA, fluoroscopy time did not strongly correlate with radiation exposure. This indicates that factors other than FT may be more influential in CA. To optimize protocols, focus could be shifted to reduce cine imaging use, limit the number of cine runs or their duration could reduce dose, optimize collimation and angulation. Future research should focus on how real-time dose monitoring and adjustments to fluoroscopy time can influence radiation exposure outcomes, providing opportunities to refine optimized protocols for clinical practice.
The correlations between the PKA and Ka,r and NoI values was found to be good (0.4 < R2 < 0.6) indicating an increase in exposure parameters with increasing the NoI (cf. Figs. 5 and 6). This occurs because, during IC procedures, multiple images need to be taken from different angles or positions to obtain comprehensive information about the cardiovascular system, thereby increasing the patient radiation exposure (Agarwal et al., 2014 Dawn Abbott 2014).
Protocols should aim to reduce the NoI through Predefined imaging protocols without compromising clinical outcomes. Use of 3D imaging techniques.
By focusing on factors like minimizing fluoroscopy time, controlling the number of images, optimizing collimation and angulation, and standardizing procedural techniques, cardiac interventional radiology protocols can be refined to significantly reduce radiation exposure while maintaining clinical effectiveness. (ICRP, 2013; NCRP, 2010; Miller et al., 2010 ; Ordiales et al., 2020; ACR, 2021). Future prospective studies could assess the impact of these optimized protocols in reducing radiation exposure across different patient populations and clinical settings, providing further insights into their practical applications.
Ultimately, the development and implementation of optimized radiation protocols in interventional cardiology are essential to improving patient safety while maintaining clinical effectiveness. By focusing on factors such as minimizing fluoroscopy time, controlling the number of images taken, and employing advanced imaging techniques, it is possible to significantly reduce radiation exposure without compromising procedural outcomes. The insights gained from this study highlight the need for protocols that adapt to specific procedural requirements and patient characteristics. Future prospective studies should further investigate the impact of these optimized protocols in diverse clinical settings, offering opportunities to refine radiation safety practices and ensure consistent, high-quality care across various patient populations
6 Conclusion
Typical values for CA, PCI, CA+PCI and TAVI were established for the first time at the interventional cardiology– LAUMC-RH. These values were derived from exposure parameters collected during 950 procedures. Typical values obtained in this study were in line or lower than the national DRLs and those reported in the literature. Consequently, this study highlights a good local practice and an effective dose optimization strategy with respect to patient radiation protection. These established values can serve as a benchmark for other cardiac centers in Lebanon. Meanwhile, although low typical values for PKA and Ka,r were found in this study, it is crucial to emphasize that these results do not diminish the ongoing importance of working towards further dose optimization for both patients and staff. Finally, an update of the national DRLs is deemed necessary for the most frequent interventional cardiology procedures in Lebanon.
Funding
This research did not receive any specific funding.
Conflicts of interest
The authors declare that they have no conflict of interest.
Data availability statement
The research data associated with this article is included within the article.
Author contribution statement
R. Ghosn, C. Massoud, D. El Khoury and C. Rizk developed the initial idea and designed the research approach. They also contributed to the conceptualization and methodology of this research project. R. Ghosn prepared the original draft of the paper. C. Massoud C. Rizk and D. El Khoury reviewed and edited the original draft. C. Massoud C. Rizk supervised the research project. R. Ghosn, C. Massoud, G. Ghanem, M. Soueidy and C. Rizk validated the results. All authors have read and agreed to the published version of the manuscript.
Informed consent
This article does not contain any studies involving human subjects.
References
- ACR. 2021. AAPM technical standard for diagnostic medical physics performance monitoring of radiographic equipment Revised 2021 (CSC/BOC) [Google Scholar]
- Agarwal S, Parashar A, Bajaj NS, Khan I, Ahmad I, Heupler FA Jr, Bunte M, Modi DK, Tuzcu EM, Kapadia SR. 2014. Relationship of beam angulation and radiation exposure in the cardiac catheterization laboratory. JACC Cardiovasc Interv. 7 (5): 558–566. https://doi.org/10.1016/j.jcin.2013.12.203. Epub 2014 Apr 16. PMID: 24746652. [Google Scholar]
- Balter S, Brinkman M, Kalra S, Nazif T, Parikh M, Kirtane AJ, et al. 2017. Novel radiation dose reduction fluoroscopic technology facilitates chronic total occlusion percutaneous coronary interventions. 8 (13): e1468–e1474. https://doi.org/10.4244/EIJ-D-16-00216.PMID:28741573. [Google Scholar]
- Balter, S. et al. 2010. Fluoroscopically guided interventions procedures: a review of radiation effects on patient’s skin and hair. Radiology 254 (2). [Google Scholar]
- Crowhurst JA, Whitby M, Thiele D, Halligan T, Westerink A, Crown S, Milne J. 2014. Radiation dose in coronary angiography and intervention: initial results from the establishment of a multi-centre diagnostic reference level in Queensland public hospitals. J Med Radiat Sci. 61 (3): 135–141. https://doi.org/10.1002/jmrs.67. Epub 2014 Aug 4. PMID: 26229649; PMCID: P MC4175852. [Google Scholar]
- Dawn Abbott J. 2014. Controlling radiation exposure in interventional cardiology. Cardiovasc Interv 7: 425–428. [CrossRef] [PubMed] [Google Scholar]
- Korir Geoffrey K., Jeska S. Wambani, Christine A. Yuko-Jowi, Ian K. Korir, Mark Tries, Kidali Mike M.. 2013. Establishing diagnostic reference levels for interventional procedures in Kenya. Radiography. 20 (2): 48–152. https://doi.org/10.1016/j.radi.2013.10.007. [Google Scholar]
- Georges J.L. et al. 2017. Radiation doses to patients in interventional coronary procedures estimation of updated national reference levels by dose audit. Radiat Prot Dosim 175: 17–25. [Google Scholar]
- IAEA. 1996. International Basic Safety Standards for Protection Against Ionizing Radiation and the Safety of Radiation Sources. Safety series no. 115. Vienna, Austria: International Atomic Energy Agency. [Google Scholar]
- IAEA. 2009. Establishing Guidance Levels In X Ray Guided Medical Interventional Procedures, International Atomic Energy Agency, Vienna, Safety Reports Series No. 59 [Google Scholar]
- IAEA. 2014. Safety Standards, Radiation Protection and Safety of Radiation Sources: International Basic Safety Standards. General Safety Requirements part 3. [Google Scholar]
- IAEA. 2022. Good practices in interventional procedures, RPOP, IAEA, https://www.iaea.org/resources/rpop/health-professionals/interventional-procedures/good-practices-in-interventional-fluoroscopy [Google Scholar]
- ICRP. 2000. Avoidance of radiation injuries from medical interventional procedures. ICRP Publication 85. Ann ICRP 30 (2). [Google Scholar]
- ICRP. 2012. Annals of the ICRP, ICRP publication 118 ICRP Statement on Tissue Reactions and Early and Late Effects of Radiation in Normal Tissues and Organs − Threshold Doses for Tissue Reactions in a Radiation Protection Context. [Google Scholar]
- ICRP. 2013. Radiological protection in cardiology. ICRP Publication 120. Ann ICRP 42 (1). [Google Scholar]
- ICRP. 2017. ICRP Publication 135: Diagnostic Reference Levels in Medical Imaging. Ottawa: ICRP. viewed 01 February 2021 [Google Scholar]
- Januszek R, Siłka W, Sabatowski K, Malinowski KP, Heba G, Surowiec S, Chyrchel M, Rzeszutko Ł, Bryniarski L, Surdacki A, Bartuś K, Bartuś S. 2022. Procedure-related differences and clinical outcomes in patients treated with percutaneous coronary intervention assisted by optical coherence tomography between new and earlier generation software (Ultreon™ 1.0 Software vs. AptiVue™ Software). J Cardiovasc Dev Dis 9 (7): 218. https://doi.org/10.3390/jcdd9070218. PMID: 35877580; PMCID: P MC9318712. [PubMed] [Google Scholar]
- Januszek R, Siudak Z, Malinowski KP, Wańha W, Surowiec S, Heba G, Pawlik A, Kameczura T, Wojakowski W, Jaguszewski M, Kołodziej A, Bryniarski L, Bartuś K, Surdacki A, Dobrzycki S, Legutko J, Bartuś S. 2023. Factors determining the frequency of optical coherence tomography and intravascular ultrasound use in patients treated with percutaneous coronary interventions in recent years: Analysis based on a large national registry. Kardiol Pol 81 (10): 969–977. https://doi.org/10.33963/KP.a2023.0151. Epub 2023 Jul 4. PMID: 37401576. [CrossRef] [PubMed] [Google Scholar]
- Järvinen J, Sierpowska J, Siiskonen T, Järvinen H, Kiviniemi T, Rissanen TT, Matikka H, Niskanen E, Hurme S, Larjava HRS, Mäkelä TJ, Strengell S, Eskola M, Parviainen T, Hallinen E, Pirinen M, Kivelä A, Teräs M. 2019. Contemporary radiation doses in interventional cardiology: a nationwide study of patient doses in finland. Radiat Prot Dosim 185 (4): 483–493. https://doi.org/10.1093/rpd/ncz041. PMID: 30989216. [Google Scholar]
- Kataria V, Yaduvanshi I, Singal G, Nair M. 2021. Establishing a diagnostic reference level of radiation dose in coronary angiography and intervention: a prospective evaluation. Indian Heart J 73 (6): 725–728. https://doi.org/10.1016/j.ihj.2021.09.012. Epub 2021 Sep 21. PMID: 34861982; PMCID: P MC8642644. [CrossRef] [PubMed] [Google Scholar]
- Kidoń J, Kinga P-G., Leszek W. 2022. Local diagnostic reference levels and effective doses: single institution levels for interventional cardiology procedures for adult patients. J Polish Soc Med Phys 28 (2). https://doi.org/10.2478/pjmpe-2022-0009 [Google Scholar]
- Miller DL, et al. 2010. Cardiovascular and interventional radiology society of europe; society of interventional radiology. Occupational radiation protection in interventional radiology: a joint guideline of the cardiovascular and interventional radiology society of Europe and the society of interventional radiology. J Vasc Interv Radiol 21 (5): 607–615. https://doi.,org/10.1016/j.,jvir.2010.01.007. PMID: 20430294. [CrossRef] [PubMed] [Google Scholar]
- NCRP report No 168. 2010. Radiation Dose Management for Fluoroscopically-Guided Interventional Medical Procedures. [Google Scholar]
- Ordiales JM, Nogales JM, Martinez G, García P, Benedicto A, Castillo MFR, Torres LP, Font J, Bethencourt A, Cesteros MJ, Pérez A, Pinar E, Tobarra B. 2020. Updating national diagnostic reference levels for interventional cardiology and methodological aspects. Phys Med 70: 169–175. https://doi.org/10.1016/j.ejmp.2020.01.014. Epub 2020 Feb 5. PMID: 32032801. [CrossRef] [PubMed] [Google Scholar]
- Padmanabhan D, Shankar S, Chandrashekharaiah A, Deshpande S. 2019. Strategies to reduce radiation exposure in electrophysiology and interventional cardiology. US Cardiol Rev 13 (2): 117–122. https://doi.org/10.15420/usc.2019.21.2 [Google Scholar]
- Padovani R, Bernardi G, Malisan MR, et al. 2001. Patient dose related to the complexity of interventional cardiology procedures. Radiat Prot Dosim 94: 189–92. PubMed. [CrossRef] [PubMed] [Google Scholar]
- Ramanathan V, Senarathna HS, Gunaratna HU, Bandara PM, Horadigala CJ. 2023. Establishment of institutional diagnostic reference level for coronary angiography procedures in Sri Lanka. Radiat Prot Dosim 199 (19): 2311–2317. https://doi.org/10.1093/rpd/ncad238. PMID: 37624229. [CrossRef] [PubMed] [Google Scholar]
- Rizk C, Farah J, Vanhavere F, Fares G. 2019. National diagnostic reference levels in interventional radiology suites in lebanon: a multicenter survey. Radiat Prot Dosim 187 (1): 50–60. https://doi.org/10.1093/rpd/ncz137. Advance Access publication 21 May 2019. [CrossRef] [PubMed] [Google Scholar]
- Ruiz-Cruces R. et al. 2016. Diagnostic reference levels and complexity indices in interventional radiology: a national programme. Eur Radiol 26: 4268–4276. [CrossRef] [PubMed] [Google Scholar]
- Ryckx N, Goy J, Stauffer J, Verdun FR. 2016. Patient dose assessment after interventional cardiology procedures: a multi-centric approach to trigger optimization. Radiat Prot Dosim 169: 249–252. [CrossRef] [PubMed] [Google Scholar]
- Sánchez R, Vañó E, et al. 2020. Updating national diagnostic reference levels for interventional cardiology and methodological aspects, Phys Med 70: 169–175. https://doi.org/10.1016/j.ejmp.2020.01.014. [CrossRef] [PubMed] [Google Scholar]
- Schegerer A, Loose R, Heuser LJ, Brix G. 2019. Diagnostic reference levels for diagnostic and interventional X-ray procedures in Germany: update and handling. Rofo. 191 (8): 739–751. English, German. https://doi.org/10.1055/a-0824-7603. Epub 2019 Jan 21. PMID: 30665250. [Google Scholar]
- Siiskonen T, Ciraj-Bjelac O, Dabin J, Diklic A, Domienik-Andrzejewska J, Farah J, Fernandez JM, Gallagher A, Hourdakis CJ, Jurkovic S, Järvinen H, Järvinen J, Knežević Ž, Koukorava C, Maccia C, Majer M, Malchair F, Riccardi L, Rizk C, Sanchez R, Sandborg M, Merce MS, Segota D, Sierpowska J, Simantirakis G, Sukupova L, Thrapsanioti Z, Vano E. 2018. Establishing the European diagnostic reference levels for interventional cardiology. Phys Med 54: 42–48. https://doi.org/10.1016/j.ejmp.2018.09.012. Epub 2018 Sep 27. PMID: 30337009. [CrossRef] [PubMed] [Google Scholar]
- Slave O, Mahomed N. 2023. An audit of patient radiation doses in interventional radiology at a South African hospital. S Afr J Rad 27 (1): a2559. https://doi.org/10.4102/sajr.v27i1.2559. [CrossRef] [Google Scholar]
- Srimahachota S, Trinavarat P, Sukwijit K, Sudchai W, Kaewta K, Chamnan M, Pitaksuteepong T, Na Nan R, Sae-oui A, Torpongpun A, Namkoch N, Kupharangchotsin M, Thungsuk S, Krisanachinda A. 2022. National diagnostic reference levels of procedures in cardiac catheterization laboratory in thailand: a multi centers survey. J Med Assoc Thai 105 (9): 784–789. [CrossRef] [Google Scholar]
- Tsapaki V, Ahmed NA, AlSuwaidi JS, Beganovic A, Benider A, BenOmrane L, Borisova R, Economides S, El-Nachef L, Faj D, Hovhannesyan A, Kharita MH, Khelassi-Toutaoui N, Manatrakul N, Mirsaidov I, Shaaban M, Ursulean I, Wambani JS, Zaman A, Ziliukas J, Zontar D, Rehani MM. 2009. Radiation exposure to patients during interventional procedures in 20 countries: initial IAEA project results. AJR Am J Roentgenol 193 (2): 559–569. https://doi.org/10.2214/AJR.08.2115. PMID: 19620457. [CrossRef] [PubMed] [Google Scholar]
- UNSCEAR. 2010. Sources and Effects of Ionizing Radiation. Volume I: Sources: Report to the General Assembly, Scientific Annexes A and B. UNSCEAR 2008 Report. United Nations Scientific Committee on the Effects of Atomic Radiation. United Nations sales publication E.10.XI.3. United Nations, New York. [Google Scholar]
- UNSCEAR. 2022. Sources, Effects and Risks of Ionizing Radiation. Volume I: Sources: Report to the General Assembly, Scientific Annexes A. UNSCEAR 2020/2021 Report. United Nations Scientific Committee on the Effects of Atomic Radiation. United Nations sales publication E.22.IX.1. United Nations, New York. [Google Scholar]
- Valentin J. 2000. Avoidance of radiation injuries from medical interventional procedures. Ann ICRP 30: 7–67. Crossref, Medline. [PubMed] [Google Scholar]
Cite this article as: Ghosn R, Massoud C, Ghanem G, Soueidy M, El Khoury D, Rizk C. 2025. Typical local DRL values for interventional cardiology procedures. Radioprotection 60(2): 134–143. https://doi.org/10.1051/radiopro/2024053
All Tables
Number (#) of procedures, mean (minimum − maximum) values of the age, height and weight for each type interventional cardiology procedure.
Number (#) of procedures, mean (minimum −maximum) and median (Q1–Q3) values of the distributions of each exposure parameter (FT, Ka,r, PKA, NoE and NoI) for interventional cardiology procedures. P-value results from the Kruskal-Wallis test for the four procedures (CA, PCI, CA+PCI, and TAVI) were also presented.
Comparison of typical values from this study with National DRLs and other international studies.
All Figures
|
Fig. 1 The relationship between PKA (Gycm2) and BMI (Kg/m2) during a) CA procedures (R2 = 0.15), b) PCI procedures (R2 = 0.01), c) CA+ PCI procedures (R2 = 0.08) and d) TAVI procedures (R2 = 0.01). |
| In the text | |
|
Fig. 2 The relationship between Ka,r (mGy) and BMI (Kg/m2) during a) CA procedures (R2 = 0.13), b) PCI procedures (R2 = 0.04), c) CA+ PCI procedures (R2 = 0.06) and TAVI procedures (R2 = 0.04). |
| In the text | |
|
Fig. 3 The relationship between Ka,r (mGy) and FT (min) during a) CA procedures (R2 = 0.37), b) PCI procedures (R2 = 0.64), c) CA+ PCI procedures (R2 = 0.63) and TAVI procedures (R2 = 0.69). |
| In the text | |
|
Fig. 4 The relationship between PKA (Gycm2) and FT (min) during a) CA procedures (R2 = 0.40), b) PCI procedures (R2 = 0.74), c) CA+ PCI procedures (R2 = 0.62) and TAVI procedures (R2 = 0.68). |
| In the text | |
|
Fig. 5 The relationship between PKA (Gycm2) and NoI during a) CA procedures (R2 = 0.48), b) PCI procedures (R2 = 0.41), c) CA+ PCI procedures (R2 = 0.43) and TAVI procedures (R2 = 0.46). |
| In the text | |
|
Fig. 6 The relationship between Ka,r (mGy) and NoI during a) CA procedures (R2 = 0.58), b) PCI procedures (R2 = 0.60), c) CA+ PCI procedures (R2 = 0.45) and TAVI procedures (R2 = 0.55). |
| In the text | |
Current usage metrics show cumulative count of Article Views (full-text article views including HTML views, PDF and ePub downloads, according to the available data) and Abstracts Views on Vision4Press platform.
Data correspond to usage on the plateform after 2015. The current usage metrics is available 48-96 hours after online publication and is updated daily on week days.
Initial download of the metrics may take a while.