")
")
| Issue |
Radioprotection
Volume 60, Number 1, January-March 2025
|
|
|---|---|---|
| Page(s) | 44 - 49 | |
| DOI | https://doi.org/10.1051/radiopro/2024040 | |
| Published online | 14 mars 2025 | |
Article
Diagnostic reference levels for adult computed tomography at the University Hospital Center of Marrakech (Morocco)
1
Higher Institute of Nursing Professions and Health Technics, Marrakech, Morocco
2
Environmental, Ecological and Agro-Industrial Engineering Laboratory, University Sultan Moulay Sliman, Béni Mellal, Morocco
3
Sultan Moulay Sliman University, Faculty of Sciences and Techniques, Department of Physics (LPM), B.P.523, 23000 Beni-Mellal, Morocco
* Corresponding author: Cette adresse e-mail est protégée contre les robots spammeurs. Vous devez activer le JavaScript pour la visualiser.
Received:
18
June
2024
Accepted:
20
August
2024
Abstract
In this research, the diagnostic reference level (DRL) for routine computer tomography (CT) exams at the Arrazi Hospital of the Mohammed VI University Hospital Center (Med VI UHC) in Marrakech, Morocco, was established. The DRL for routine CT scans was derived through prospective research. Based on recommendation for computing DRL by various international legal organisations, we took into account the CT Volume Dose Index CTDIvol (mGy) and the Dose-Length Product DLP (mGy.cm) as dosimetric quantities. The statistics calculated of the CTDIvol and DLP 75th percentiles were suggested as DRLs. The DRLs obtained for the head, chest-abdomen-pelvis (CAP), chest, and abdomen were 39 mGy, 8 mGy, 11 mGy, 9 mGy, and 1445 mGy.cm, 825 mGy.cm, 700 mGy.cm, and 788 mGy.cm, respectively. When compared to the published values, the DRLs found in the present search are more elevated.
Key words: CT / CTDIvol / DLP / DRL
© H. Khajmi et al., Published by by EDP Sciences 2025
 This is an Open Access article distributed under the terms of the Creative Commons Attribution License (https://creativecommons.org/licenses/by/4.0), which permits unrestricted use, distribution, and reproduction in any medium, provided the original work is properly cited.
1 Introduction
Medical X-rays are the highest man-made source of radiation exposure for the general population, and they are crucial for the detection and treatment of pathology through X-ray scans (Chougule, 2005). Even though X-ray imaging provides a lot of benefits and is a very important part of healthcare (Hall et al., 2008). Compared to traditional x-rays, computed tomography (CT) has a high radiation dosage that can range from ten to one hundred times higher (Mettler et al., 2008). Similar to all existing diagnostic imaging modalities, the usage of CT for medical diagnosis has significantly expanded since 1972, particularly with the introduction of multidetector CTs (MDCT) (Saravanakumar et al., 2016).
Despite mounting demand to use CT for diagnosis, there is still a paucity of detailed instructions on how to conduct a CT scan while maximizing image quality and exposing the patient to the least amount of radiation (Saravanakumar et al., 2016). Diagnostic reference levels DRLs are a well-known tool for optimizing medical exposures and are used to see the blurred line between excellent or normal practice and practices that induces higher doses to the patient (IPEM, 2004). Additionally, DRL plays a vital role in promoting good radiological practice in medical imaging (ICRP, 2011).
In accordance with the International Commission on Radiological Protection (ICRP, 2017), DRL is a factor in promoting good radiological practice in medicine. These dose levels are intended for typical examinations for groups of standard-sized patients and do not establish a distinction between “good” and "bad" medicine. Besides, diagnostic reference levels are critical for dosage optimisation for CT exams. The concepts for establishing DRLs are outlined in the recommendations of the worldwide commission on radiological protection (ICRP, 2007) (Report 103), together with explicit definitions of local, regional, and national goals.
Over the past few years, various studies (Zira et al., 2017; Tsapaki et al., 2021; Paulo et al., 2020; Sutton et al., 2014; Osman et al., 2023; Radaideh et al., 2023) have been carried out to identify DRLs for various CT examinations at both the national and regional levels using a variety of sample sizes. ICRP (2011) and International Atomic Energy Agency (IAEA, 2016) organisations, declare that diagnostic reference levels (DRLs) are tools for optimizing medical radiation protection in the diagnostic field.
Morocco has a large number of CT scanners for radiology departments in different regions of the country, which contribute to the daily medical imaging of patients. Recently, studies published in the Kingdom have described the DRLs for CT scanners by province and by individual hospitals (El Fahssi et al., 2024; Semghouli et al., 2024; Nhila et al., 2024; Tahiri et al., 2024), indicating that CT scanners are subject to regular upkeep. In addition, numerous works conducted in the nation (Andaloussi et al., 2021; Tahiri et al., 2022; Amaoui et al., 2023; Housni et al., 2023) have reported the theoretical understanding of radiation protection by radiologists, technologists, and medical physicists.
The DRL is crucial information for identifying outlier doses, especially in high-dose facilities, allowing us to suggest better radiation protection measures and lessen the dose load for CT examination patients. The results of this research will help identify practices that need immediate action to reduce the risk of radiation for patients undergoing CT exams in Marrakech.
According to ICRP (2011) the present study aimed at defining local DRLs for adult CT procedures at the Mohammed VI University Hospital Center in Marrakech (Med VI UHC) (Morocco) and to evaluate it against previous international research (Smith-Bindman et al., 2015; Kanda et al., 2021; Zewdu et al., 2021; Li Z et al., 2020; Bashier et al., 2018; Shrimpton et al., 2014; Roch et al., 2018).
2 Materials and methods
The radiology departments of Arrazi Hospital of Marrakech, Morocco’s Med VI UHC, served as the study’s locations. With a bed capacity of 1548 and four scanners, Med VI UHC is one of Morocco’s four largest academic, scientific, and medical facilities. The centre offers both general and specialty services to a population of 8055610. The number of conventional radiographs and digital images achieved in 2022 were 85103 and 65440, respectively.
Retrospective obtaining data was conducted for diagnostic CT scan collected in the period between December and May 2023 at the Arrazi Hospital facility associated with the Med VI UHC of Marrakech for routine CT examinations. The CT procedures were performed with Siemens Somatom Sensation 16, installed in 2008, periodically well maintained, and equipped with intensity modulation and iterative reconstruction. Demographic information (gender), CT exposure parameters (tube voltage (kV), tube current time-product (mAs), pitch, and CT dose quantity (CTDIvol, DLP) for adult patients between the ages of 18 and 80 years underwent routine CT scans in the radiology department were all gathered. The acquisition variables and dose quantities were directly taken from the DICOM structured dose reporting system. Head, chest-abdomen-pelvis (CAP), chest, and abdomen procedures were the routine exams considered in this investigation. The choice of these examinations was due to their high frequencies. No selection of weight, height, and other scan parameters was performed in this study. We selected the dosimetric data for each anatomical location with and without contrast injection. For all CT tests considered (Tab. 1), helical scanning type was performed.
Data obtained in this study, including mean, minimum, and maximum, as well as percentiles for CTDIvol (mGy) and DLP (mGy.cm) numbers found.
2.1 Patient sampling
We proposed to assess and compare the radiation doses delivered to 640 patients of both sexes at the Arrazi Hospital of the Med VI UHC in Marrakech during the study period December and May 2023. In order to create our DRLs according to ICRP (2011), we have gathered dosimetry numbers from more than 30 CT scans per anatomical area with and without contrast. Table 2 summarises the statistics obtained.
Estimated 75th percentile of CTDIvol(mGy) and DLP(mGy.cm) numbers for head, CAP, chest, and abdomen CTs in this work compared to other countries.
2.2 Statistical analysis
The data was analysed using statistical software from IBM SPSS version 26. For exam, the values for the 75th percentile were determined. The minimum and maximum levels of voltage (kV) and intensity (mAs), as well as the mean, 50th and 75th percentiles of the dose metric distribution, were calculated as the DRL (ICRP, 2011). The results were examined using descriptive statistics. The 75th percentiles of the measurements were compared with the DRLs in studies that were published on a number of continents (Smith-Bindman et al., 2015; Kanda et al., 2021; Zewdu et al., 2021; Li Z et al., 2020; Bashier et al., 2018; Shrimpton et al., 2014; Roch et al., 2018) and ICRP (2017). These numbers, which are the first exclusive to the Med VI UHC’s Arrazi Hospital, were gathered for the CT scan diagnostic reference levels. The findings of this study will govern future research on dosage.
3 Results and discussion
We obtained the dosage information from 640 CT exams. Abdominal CT accounts for 28% (n = 179) of scans, followed by head (26%) (n = 166), CAP (24%) (n = 155), and chest (22%) (n = 140). Table 1 shows the distribution of the tube voltage used for adults CT. For all CT procedures, the tube voltage used for head, CAP, chest and abdominal scans ranges from 120 kV to 140 kV. The tube current fluctuated similarly, ranging from 224 mAs to 450 mAs, 45 mAs to 339 mAs, 48 mAs to 246 mAs, 71 mAs to 361 mAs, and from 71 mAs to 361 mAs. We notice that, the majority of CT exams are performed with a slice thickness of 5 mm, although the pitch for all CT acquisitions under review range from 0.55 to 1.5. The CTDIvol (mGy) and DLP(mGy.cm) quantities obtained in this investigation for all CT procedures are shown in Table 2 as the lowest, mean, maximum, 50th, and 75th results.
For a CT of the head, the DLP varies from 1281 mGy.cm to 1724 mGy.cm, with a mean of 1422 mGy.cm, while the CTDIvol varied from 34 mGy to 40 mGy, with a mean of 38 mGy, the CTDIvol and DLP at the 75th percentiles are 40 mGy and 1445 mGy.cm, respectively. Figure 1 shows the frequency distribution of DLP (mGy.cm) of the head CT. It is clear that a minor group of patients have a higher DPL value on head CT. This could mean that, in some cases, a different protocol is used.
The comparison between our DRL and various countries proposed standards are shown in Table 2. Except for research reported by Sudan in 2018 (Bashier et al., 2018) and Ethiopia in 2021 (Zewdu et al., 2021), the DRL of our CTDIvol in this paper is lower than all numbers reported internationally. However, it was discovered that the established DLP at the head CT’s 75th percentile was superior to all of the DRL stated in worldwide reference dosages. One possible explanation for these high dosimetric situations might be the usage of mAs and kVp at levels beyond the internationally advised threshold. In reality, the dosage distribution in a CT scan may be affected by taking into account the patient’s gender, skull shape, and size.
The CTDIvol for CAP CT varied from 3 mGy to 12 mGy, with a mean of 7 mGy and the DLP ranges from 354 mGy.cm to 1222 mGy.cm, with a mean of 710 mGy.cm. The CTDIvol and DLP at the 75th percentiles for CT of the chest to pelvis CT were 8 mGy and 825 mGy.cm, respectively. The DRLs of chest to pelvis CT in terms of CTDIvol in this research is lower than the DRL observed in Japan in 2020 (Kanda et al., 2021) and in French in 2018 (Roch et al., 2018). Japan in 2020 (Kanda et al., 2021) has the highest DRL (1200 mGy) of DLP values.
The estimated CTDIvol for chest CT ranged from 3 mGy to 17 mGy, with a mean of 9 mGy, and the DLP ranged from 333 mGy.cm to 874 mGy.cm, with a mean of 598 mGy.cm. Figure 2 presents the frequency distribution of DLP(mGy.cm) of the chest CT. This histogram displays a homogenous distribution of DLP values-albeit one that is neither gaussian or normal. The DRL of CTDIvol of chest CT is 11 mGy in this study, it is moderately more than those found in earlier research from the UK noted in 2014 (Shrimpton et al., 2014), Sudan 2018 (Bashier et al., 2018), China 2020 (Li et al., 2020), Ethiopia 2021 (Zewdu et al., 2021), and French 2018 (Roch et al., 2018). However, the level was very lower than that of the ICRP in 2017 (ICRP, 2017) (173%), USA (54.5%) (Smith-Bindman et al., 2015), and Japan (18%) (Kanda et al., 2021) studies. The DLP at the 75th percentile for chest CT is 700 mGy.cm, it was above than all different publications proposed DRLs. The age of the scanners, institutionally favoured procedures, availability of dose reduction algorithms, and variations in scan lengths can all be factors contributing to variations in dosimetric results for chest CT scans among studies (Arlany et al., 2023).
The abdominal CTDIvol and DLP ranged from 5 mGy to 12 mGy, with a mean of 7 mGy, and from 121 mGy.cm to 1021 mGy.cm, with a mean of 454 mGy.cm, respectively. The CTDIvol at the 75th percentile for abdomen CT in this work was 9 mGy. With the exception of Sudan in 2018 (Bashier et al., 2018), all internationally reported numbers were higher. The DRL of DLP in abdomen CT was 788 mGy.cm. It is similar to that recommended by ICRP (2011), but showed the greatest difference when compared with other studies. It was 65.7% greater than that reported in Sudan in 2018 (Bashier et al., 2018), 44% larger than that seen in China in 2020 (Li et al., 2020), 41.6% more elevated than that mentioned in the UK during 2014 (Shrimpton et al., 2014), and 20 % more than that was registered in French through 2018 (Roch et al., 2018), but was lower than that of the USA in 2015 (9.1%) (Smith-Bindman et al., 2015), Japan in 2020 (10.1%) (Kanda et al., 2021), Ethiopia in 2021 (100%) (Zewdu et al., 2021) and French in 2022. We notice that, Ethiopia in 2021 (Zewdu et al., 2021) have the maximum DRL quantities.
In the Med VI UHC of Marrakech (Morocco), our recent analysis offers the first hospital-based DRL for head, chest to pelvis, chest, and abdomen 16-Multislice CT exams for adult’s patients. The 75th percentile of the DLP of the head and chest CT were greater according to the study’s findings than in other, internationally published research. Contrarily, except for the USA in 2015 (Smith-Bindman et al., 2015), Japan in 2020 (Kanda et al., 2021), Ethiopia in 2021 (Zewdu et al., 2021), the abdomen CT rate was above than those observed in UK in 2015 (Shrimpton et al., 2014), Sudan in 2018 (Bashier et al., 2018), China in 2020 (Li et al., 2020) and in French in 2018 (Roch et al., 2018). Japan 2020 (Kanda et al., 2021) has the largest DLP in CAP CT.
The 75th percentile dose measures for these procedures are, however, lower or greater than those published worldwide. In fact, compared to CT examinations conducted in other nations, the high doses and dosage variability seen on the DRL during this analysis seem to be mostly impacted by technological considerations as well as changes in the protocols employed.
Numerous actions must be taken in order to reduce the amount of radiation patients receive, including: First, offer real-time automatic exposure control technology during scanning. Second, lower radiation levels by using the iterative reconstruction process. Thirdly, the education and training of CT technicians should be improved to create a more standardised workflow for CT scans, including patient preparation prior to the examination and the setting of scan parameters to precisely formulate the scanning plan and prevent the need for repeat scans because of operational errors. Fourthly, to get the lowest radiation dose without compromising picture quality or patient care, a coordinated effort by radiologists, technologists, and medical physicists must be used. Finally, quality assurance of CT equipment is also necessary.
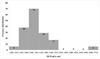 |
Fig. 1 Frequency distribution of DLP (mGy.cm) of the head CT. The values are presented by number of patients and in 50 mGy.cm interval. |
 |
Fig. 2 Frequency distribution of DLP (mGy.cm) of the chest CT. values are presented by number of patients and interval of 100 mGy.cm. |
4 Conclusion
This study, carried out in the computed tomography unit of the radiology section of the Arrazi Hospital of the Mohammed VI University Hospital Centre in Marrakech, assessed the current practice of this unit. This research focuses on the estimation of the DRL in adult CT scans.
The results of this exercise demonstrated that the predicted DRL for the head and chest scans were greater than the guidelines suggested by the literature. Even if DRL for abdomen CT was not more than the international levels, it can be reduced by adequate training of radiographers. We believe that the Med VI UHC in Marrakech has to optimize its radiological practice in CT.
Acknowledgments
We are grateful to the students at the Higher Institute of Nursing Professions and Health Technics, as well as the radiology technicians at the Mohammed VI University Hospital Center in Marrakech, Morocco’s Arrazi Hospital, for their assistance with collecting the information.
Funding
The study’s authors did not receive any funding for it.
Conflicts of interest
There is no conflict of interest for this paper.
Data availability statement
The authors do not have permission to share data.
References
- Amaoui B, Safini F, Lahlou L, El Fahssi M, Abbaoui S, Semghouli S. 2023. Physicians’ knowledge about radiation protection of patients during prescription of CT scan procedures in Morocco. Radiat Med Protect 4 (01): 54–59. [CrossRef] [Google Scholar]
- Andaloussi LH, Harrass H, Aschawa H, Hlousse FZ. 2021. Medical staff who use ionizing radiation at Ibn Rochd University Hospital Center of Casablanca, Morocco: evaluation of radiation protection knowledge, E3S Web Conf. 319: 01046. [Google Scholar]
- Arlany L, Toh HG, Nazir B, Ng JJ, Tay YH, Tay YS, Chong LR. 2023. Establishment of CT diagnostic reference levels (DRLs) for a Singapore healthcare cluster. Radiography 29 (1): 184–189. [CrossRef] [PubMed] [Google Scholar]
- Bashier EH, Suliman II. 2018. Multi-slice CT examinations of adult patients at Sudanese hospitals: radiation exposure based on size-specific dose estimates (SSDE). La Radiolog Med 123 (6): 424–431. [CrossRef] [PubMed] [Google Scholar]
- Chougule A. 2005. Reference dose in radiological imaging. Pol J Med Phys Eng 11: 115–126. [Google Scholar]
- EL Fahssi M, Semghouli S, Amaoui B, Jroundi L, Caoui M. 2024. Patient radiation doses from adult CT examinations at the Souss Massa Regional Hospital. Radioprotection 59 (1): 13–18. [CrossRef] [EDP Sciences] [Google Scholar]
- Hall EJ, Brenner DJ. 2008. Cancer risk from diagnostic radiology. Br J Radiol 81: 362–378. [CrossRef] [PubMed] [Google Scholar]
- Housni A, ES-Samssar O, Saoud B, El Amrani N, Malou M, Amazian K, Labzour A. 2023. Radiation protection in the operating room: Need for training, qualification and accompaniment for the professionals. Radioprotection 58 (1): 37–42. [CrossRef] [EDP Sciences] [Google Scholar]
- IAEA. 2016. Technical Meeting on Patient Dose Monitoring and the Use of Diagnostic Reference Levels for the Optimization of Protection in Medical Imaging. International Atomic Energy Agency. Available at: https://rpop.iaea.org/rpop/rpop/Content/News/6-tm-patient-dose-monitoring.htm, 2016 (accessed 19.05.17). [Google Scholar]
- International Commission on Radiological Protection (ICRP). 2007. Recommendations of the International Commission on Radiological Protection. ICRP publication 103. Ann. ICRP 37 (2-4): 1–332. [Google Scholar]
- International Commission on Radiological Protection (ICRP). 2011. Diagnostic reference levels in medical imaging: Review and additional advice. Ann ICRP 31 (4): 33–35. [Google Scholar]
- ICRP. 2007. Radiation protection in medicine. ICRP Publication 105. Ann ICRP 37: 1–63. [Google Scholar]
- ICRP. 2017. Diagnostic reference levels in medical imaging. ICRP Publication 135. Ann. ICRP 46 (1): 1–144. [Google Scholar]
- IPEM. Report 88, 2004. Guidance on the establishment and use of diagnostic reference levels for medical X-ray examinations. York, UK: IPEM. [Google Scholar]
- Kanda R, Akahane M, Koba Y, Chang W, Akahane K, Okuda Y, Hosono M. 2021. Developing diagnostic reference levels in Japan. Jpn J Radiol 39: 307–314. [CrossRef] [PubMed] [Google Scholar]
- Li Z, Zhang J, Xia C, Zhao F, Zhang K, Li Y, Li L, Pu J, Peng W, Liu K, Guo Y. 2020. Radiation doses in CT examinations from the West China Hospital, Sichuan University and setting local diagnostic references levels. Ann Transl Med 8 (16): 1010. [CrossRef] [PubMed] [Google Scholar]
- Mettler Jr FA, Huda W, Yoshizumi TT, Mahesh M. 2008. Effective doses in radiology and diagnostic nuclear medicine: a catalog 1. Radiology 248: 254–263. [CrossRef] [PubMed] [Google Scholar]
- Nhila O, Talbi M, Youssoufi MA, El Mansouri M, Tahiri Z, Chakir EM, Azougagh M. 2024. Establishment of local diagnostic reference levels for breast cancer CT protocols in radiotherapy in a single Moroccan center. Radioprotection 59 (1): 50–54. [CrossRef] [EDP Sciences] [Google Scholar]
- Osman H, Alosaimi M, Alghamdi F, Aljuaid A, Alqurashi M, Aldajani S, Suleiman A. 2023. Evaluation of CT dose and establishment of local DRLs for abdomen and pelvis examinations in hospitals in Taif City, Saudi Arabia. Radiat Phys Chem 202: 110206. [CrossRef] [Google Scholar]
- Paulo G, Damilakis J, Tsapaki V, Schegerer AA, Repussard J, Jaschke W, Frija G. 2020. Diagnostic Reference Levels based on clinical indications in computed tomography: a literature review. Insights Imag 11 (1): 1–9. [CrossRef] [Google Scholar]
- Radaideh K, Al-Radaideh A, Ramli RM, Saleh A, Alshayeb R. 2023. Establishment of national diagnostic dose reference levels (DRLs) for routine computed tomography examinations in Jordan. Pol J Med Phys Eng 29 (1): 26–34. [Google Scholar]
- Roch P, Célier D, Dessaud C, Etard C. 2018. Using diagnostic reference levels to evaluate the improvement of patient dose optimisation and the influence of recent technologies in radiography and computed tomography. Eur J Radiol 98: 68–74. [CrossRef] [PubMed] [Google Scholar]
- Saravanakumar A, Vaide k i K, Govindarajan K, Davanand B, Jayakumar S, Sharma SD. 2016. Establishment of computed tomography reference levels in selected procedures in south India. Int J Radiat Res 14 (4): 341–347. [CrossRef] [Google Scholar]
- Semghouli S, El Hamidi L, Aabid M, Amaoui B. 2024. Evaluation of radiation dose and establishment of local DRLs for adult during abdominopelvic CT scan imaging for university hospital centers, Morocco. Radioprotection 59 (1): 42–49. [CrossRef] [EDP Sciences] [Google Scholar]
- Shrimpton PC, Hillier MC, Meeson S, Golding SJ. 2014. Doses from Computed Tomography (CT) Examinations in the UK − 2011 Review, Public Health England. [Google Scholar]
- Smith-Bindman R, Moghadassi M, Wilson N, Nelson TR, Boone JM, Cagnon, CH, Miglioretti DL. 2015. Radiation doses in consecutive CT examinations from five University of California Medical Centers. Radiology 277 (1): 134–141. [CrossRef] [MathSciNet] [PubMed] [Google Scholar]
- Sutton DG, McVey S, Gentle D, Hince AJ, MacDonald, N, McCallum S. 2014. CT chest abdomen pelvis doses in Scotland: has the DRL had its day? Br J Radiol 87 (1041): 20140157. [CrossRef] [PubMed] [Google Scholar]
- Tahiri Z, Talbi M, El Mansouri M. 2022. Evaluation of Moroccan physician’s knowledge about radiation doses and risks from pediatric computed tomography. Radioprotection 57 (2): 123–126. [CrossRef] [EDP Sciences] [Google Scholar]
- Tahiri Z, Talbi M, El Mansouri M, Sekkat H, Mkimel M, Nhila O, Essendoubi M, Hiroual S. 2023. Radiation exposure in routine mammography screening: a large observational cross-sectional study in Morocco. Radioprotection 59 (2): 104–110. [Google Scholar]
- Tsapaki V, Damilakis J, Paulo G, Schegerer AA, Repussard J, Jaschke W, Frija G. 2021. CT diagnostic reference levels based on clinical indications: results of a large-scale European survey. Eur Radiol 31: 4459–4469. [CrossRef] [PubMed] [Google Scholar]
- Zewdu M, Kadir E, Tesfaye M, Berhane M. 2021. Establishing local diagnostic reference levels for routine computed tomography examinations in jimma university medical center south west Ethiopia. Radiat Protect Dosim 193 (3-4): 200–206. [CrossRef] [PubMed] [Google Scholar]
- Zira JD, Nzotta CC, Skam JD. 2017. Diagnostic reference levels (DRLS) for computed tomography (CT) examinations in North Eastern Nigeria. PJR 27. [Google Scholar]
Cite this article as: Khajmi H, Mounir A, Tounsi A, Lhouceine O. 2025. Diagnostic reference levels for adult Computed Tomography at the University Hospital Center of Marrakech (MOROCCO). Radioprotection 60(1): 44–49. https://doi.org/10.1051/radiopro/2024040
All Tables
Data obtained in this study, including mean, minimum, and maximum, as well as percentiles for CTDIvol (mGy) and DLP (mGy.cm) numbers found.
Estimated 75th percentile of CTDIvol(mGy) and DLP(mGy.cm) numbers for head, CAP, chest, and abdomen CTs in this work compared to other countries.
All Figures
|
Fig. 1 Frequency distribution of DLP (mGy.cm) of the head CT. The values are presented by number of patients and in 50 mGy.cm interval. |
| In the text | |
|
Fig. 2 Frequency distribution of DLP (mGy.cm) of the chest CT. values are presented by number of patients and interval of 100 mGy.cm. |
| In the text | |
Current usage metrics show cumulative count of Article Views (full-text article views including HTML views, PDF and ePub downloads, according to the available data) and Abstracts Views on Vision4Press platform.
Data correspond to usage on the plateform after 2015. The current usage metrics is available 48-96 hours after online publication and is updated daily on week days.
Initial download of the metrics may take a while.