")
")
| Issue |
Radioprotection
Volume 51, December 2016
Innovative integrated tools and platforms for radiological emergency preparedness and post-accident response in Europe. Key results of the PREPARE European research project
|
|
|---|---|---|
| Page(s) | S125 - S127 | |
| Section | Enhancing of the existing decision support systems with capabilities of importance – Source term estimation based on measurements and atmospheric dispersion models | |
| DOI | https://doi.org/10.1051/radiopro/2016047 | |
| Published online | 23 décembre 2016 | |
Article
Improved source term description in Eulerian models in ARGOS
1
MET – Norwegian Meteorological Institute,
P.O. Box 43, Blindern,
N-0313
Oslo, Norway
2
CERAD – Centre of Excellence for Environmental Radioactivity,
N-1432
Ås, Norway
3
NRPA – Norwegian Radiation Protection Authority,
P.O. Box 55,
N-1332
Østerås, Norway
Abstract
Atmospheric dispersion models can be formulated and implemented in two different ways, e.g. as Eulerian and Lagrangian models. These implementations have both advantages and disadvantages concerning numerical requirements and accuracy. A combination of both implementations – a hybrid approach is also possible and, we show some improvement to a pure approach, when using this method. In many practical cases of measured radioactive air concentrations, the source time and location is not known. Inverse modelling can be used to help identifying the source. Using a simplified footprint analysis, it is even possible to combine the information from several measurement stations to get an improved picture over possible sources from an atmospheric point of view.
Key words: inverse modelling / hybrid modelling / atmospheric dispersion modelling
© EDP Sciences 2016
1 Introduction
Atmospheric transport of radioactive debris can be calculated using different numerical implementations. The Norwegian Meteorological Institute runs atmospheric transport models both with a Lagrangian approach following particle trajectories and an Eulerian approach transporting concentrations of particle in pre-defined cells, so called grids. For source improvements in the Eulerian model, we developed and tested the hybrid approach, combining Lagrangian and Eulerian solutions of the advection-diffusion equation. This was done in two steps. In the first step, we compared selected analytical solutions with the numerical results from the Lagrangian, Eulerian and the hybrid methods. In the second step, the hybrid method was applied and tested in the real meteorological conditions, as a combination of the Lagrangian SNAP model (Bartnicki et al., 2014) and Eulerian EEMEP model (Simpson et al., 2012). The results of both, analytical tests and tests in the real meteorological conditions indicate some small improvement when the hybrid approach was applied.
The estimation of the source term using inverse modelling is a commonly requested task for dispersion modellers. Our experience in operational emergency cooperation between MET and NRPA shows that up to now, an often occurring task in case of inverse modelling is the identification of an unknown source of release of radioactive material to the air and the first priority of MET is to find the source location. The latest such real event, happened in March 2015, when increased concentrations of I-131 in the air were measured in the Nordic region (Norway, Sweden and Finland) and the location of the source term, as well as its release pattern, were not known. The SNAP model has been run in reverse dispersion mode and the resulting concentrations have been used as probabilities to better estimate the source location seen from measurement stations as well as stations which did not measure.
2 Hybrid modelling
Transport of radioactive particles in the atmosphere is modelled by computer programs following the wind-vectors. These models use different mathematical formulations, and two most common cases are the Lagrangian models and the Eulerian models. The Lagrangian models follow the emitted particles and apply wind-speeds and depositions on the particles position. Both Lagrangian and Eulerian approach to dispersion modelling has some advantages and disadvantages. In applications to atmospheric transport of radioactive compounds from nuclear accidents and nuclear explosions, one of the important problems is the treatment of a point source. Lagrangian models have an advantage due to exact positioning, but struggle with a long term release and atmospheric transport in regional and global scale. Eulerian models, on the other hand, have a severe problem with parameterization of the point source term, especially if the grid size is relatively large. Another, major problem related to applications of the Eulerian models is an artificial numerical diffusion.
The hybrid approach in this case included two steps. In the first step, the SNAP model was run for 24 h. Transport and deposition of radionuclides was simulated using 1 000 000 model particles. Each particle was assigned the time measured from its release into the air. Then 3D-concentrations derived from the SNAP model particles which were 24 h old, were used as emissions in the Eulerian model. This conversion from SNAP model to EEMEP was repeated at every hour. The EEMEP model was run for 40 h, starting 24 h after the SNAP model and the final forecast was available after 64 h from the release start.
Both models SNAP and EEMEP used the same meteorology and the same grid system of 180 × 360 nodes and 20 vertical layers. Meteorological data were updated every 3 h from the IFS NWP model. The results of the three approaches can be seen in Figure 1. There are significant differences between the results of the Lagrangian and Eulerian models, but the results of the Hybrid approach are more similar to the Eulerian model.
 |
Figure 1 Dispersion of radioactive particles with the Lagrangian SNAP, Eulerian EEMEP, and a combination of both models – Lagrangian approach. |
3 Application of inverse modelling to a real world case
In March 2015, several Nordic measurement stations measured low, but above normal, concentrations of I-131 in the air. NRPA contacted MET and asked to perform calculations that could help identify the location where the release originate and the source term (Table 1).
Backward trajectory is the most simplified form of the adjoint equation. In addition, diffusion and deposition are self-adjoint, i.e. identical in forward and adjoint mode (Robertson, 2004). It is therefore possible to run not only single trajectories in backward mode, but also a dispersion model such as SNAP backward in time with diffusion and depositions still. In the footprint analysis as proposed by Brännström and Persson (2014), detectability and non-detectability of measurements are translated to probabilities depending on air concentrations and detection limits. For a simple approach, we can translate this to:
-
The probability to find a contributing forward trajectory from a given model grid square is 1 when at least one backward trajectory can be found, coming to this grid square.
-
The probability to find a contributing forward trajectory is very small when no backward trajectory can be found for the considered grid square.
The probabilities of different space-time locations emitting radioactive particle to reach single or several measurement stations can be seen in Figure 2. The reduction of the accumulated probabilities for combined stations can be found in Figure 3. It can be seen that each additional station included in the analysis contributes to the better identification of the source location, with stations being located apart from each other being more effective in the source localization. Using inverse probabilities, it is also possible to add stations that did not measure any air-concentration. But this is dangerous since the stations have a lower detection limit, and if not taken into consideration can lead to false conclusion.
Measurements of I-131, available at the stations in Nordic countries in the considered episode in March 2015.
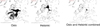 |
Figure 2 Probabilities of possible emission locations at 07 UTC on 15 of March 2015 to reach Oslo (left) and Helsinki (middle) derived from inverse SNAP runs. The right hand picture gives the combined probability. |
 |
Figure 3 Probabilities of possible emission locations accumulated over all time-steps. Combining more stations from left to right. |
4 Conclusions
Parameterization of the point source in the Eulerian models is a typical sub-scale problem with the spatial size of the source being significantly lower than the grid size. Our hybrid approach tries to simulate the pollution close to the source and shortly after initial emission with the Lagrangian model and use these results as input to the Eulerian model to improve the parameterization of the point source term. In our test-scenario, the improvement is very small and not meeting our expectations.
In our operational emergency cooperation between MET and NRPA, one occurring task for inverse modelling is to find the source location. We applied a simplified footprint analysis which enables us to increase the precision of the source location with each station. This method is very promising for finding the source location in real events with increased measured levels of radioactivity and unknown source.
Acknowledgement
The research leading to these results has received funding from the European Atomic Energy Community Seventh Framework Programme FP7/2012-2013 under grant agreement 323287.
References
- Bartnicki J., Klein H., Hosseini A., Hov Ø., Haakenstad H., Lind O.C., Salbu B., Szacinski Wendel C.C. (2014) Atmospheric Transport of Radioactive Debris to Norway in Case of a Hypothetical Accident Related to the possible Recovery of K-27 Submarine. MET Report No. 21/3013. Norwegian Meteorological Institute, Oslo, Norway. [Google Scholar]
- Brännström N., Persson L. (2014) Footprints and footprint analysis for atmospheric dispersion problems. Swedish Defense Research Agency, FOI. http://arxiv.org/pdf/1409.5419v1.pdf. [Google Scholar]
- Robertson L. (2004) Extended back-trajectories by means of adjoint equations, RMK No. 105, Swedish Meteorological and Hydrological Institute. [Google Scholar]
- Simpson D., Benedictow A., Berge H., Bergström R., Emberson L.D., Fagerli H., Hay-man G.D., Gauss M., Jonson J.E., Jenkin M.E., Nyíri A., Richter C., Semeena V.S., Tsyro S., Tuovinen J.-P., Valdebenito A., Wind P. (2012) The EMEP MSC-W chemical transport model – technical description, Atmos. Chem. Phys. 12, 7825-7865. [CrossRef] [Google Scholar]
Cite this article as: H. Klein, J. Bartnicki, J.E. Dyve. Improved source term description in Eulerian models in ARGOS. Radioprotection 51(HS2), S125-S127 (2016).
All Tables
Measurements of I-131, available at the stations in Nordic countries in the considered episode in March 2015.
All Figures
|
Figure 1 Dispersion of radioactive particles with the Lagrangian SNAP, Eulerian EEMEP, and a combination of both models – Lagrangian approach. |
| In the text | |
|
Figure 2 Probabilities of possible emission locations at 07 UTC on 15 of March 2015 to reach Oslo (left) and Helsinki (middle) derived from inverse SNAP runs. The right hand picture gives the combined probability. |
| In the text | |
|
Figure 3 Probabilities of possible emission locations accumulated over all time-steps. Combining more stations from left to right. |
| In the text | |
Current usage metrics show cumulative count of Article Views (full-text article views including HTML views, PDF and ePub downloads, according to the available data) and Abstracts Views on Vision4Press platform.
Data correspond to usage on the plateform after 2015. The current usage metrics is available 48-96 hours after online publication and is updated daily on week days.
Initial download of the metrics may take a while.