")
")
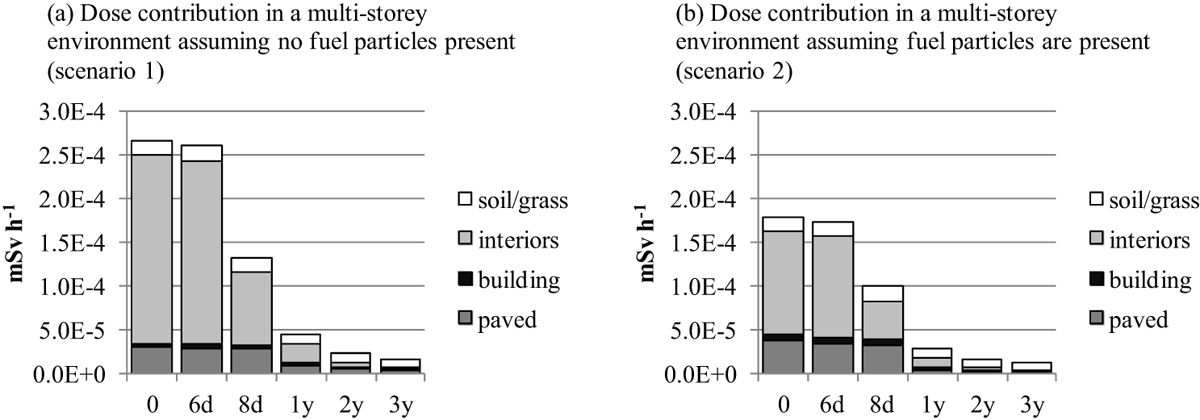
Figure 1
Download original image
Example ERMIN output showing predicted dose rates in a multi-storey building environment assuming 90% time spent indoors, a deposition of Cs-137 and washing of interior surfaces at one week. In this example, if a proportion of the contamination is in the form of fuel particles as in the case for graph (b), then interior deposition is less.
Current usage metrics show cumulative count of Article Views (full-text article views including HTML views, PDF and ePub downloads, according to the available data) and Abstracts Views on Vision4Press platform.
Data correspond to usage on the plateform after 2015. The current usage metrics is available 48-96 hours after online publication and is updated daily on week days.
Initial download of the metrics may take a while.