")
")
| Issue |
Radioprotection
Volume 60, Number 2, Avril-Juin 2025
|
|
|---|---|---|
| Page(s) | 195 - 202 | |
| DOI | https://doi.org/10.1051/radiopro/2024052 | |
| Published online | 13 June 2025 | |
Article
A low-cost environmental radiation monitoring system implemented in Brazil
Institute of Radiation Protection and Dosimetry, 3773, Rio de Janeiro, Brazil
* Corresponding renato.This email address is being protected from spambots. You need JavaScript enabled to view it.
; This email address is being protected from spambots. You need JavaScript enabled to view it.
Received:
1
August
2024
Accepted:
11
November
2024
Abstract
Nowadays, it is increasingly necessary to environmental radiation monitoring to ensure the protection of the population from nuclear or radiological accidents. In this sense, some countries have already implemented environmental monitoring networks. Despite this, Brazil not only has a radiological survey of the subsoil of its territory, but also only a small fraction of the urban environment has been monitored, not yet having a network of monitoring stations. Therefore, the objective of this paper is to present a system, already under development, which consists of an alternative form of monitoring environmental radiation, based on a device that can be installed in fleet vehicles, which travel routes according to their own operational needs, presenting itself as a low-cost system related to citizen science activities. In this case, the device itself is self-sufficient to take all the readings and send them via the mobile telephone network, depending only on energy provided by a battery. Each device is a mobile station composed of a Geiger counter, a temperature, humidity and atmospheric pressure sensor, in addition to a microcontroller associated with a telephony chip and Global Positioning System (GPS). Today the system is in the calibration and adjustments phase, already having results of a preliminary study, in which more than 25,000 readings were collected accumulated in a period of about 15 days. The results, although preliminary and in need of adjustments in the filters and visualization on the map, demonstrate the applicability and full potential of the proposed system.
Key words: environmental radiation monitoring / fleet vehicles / citizen science / Brazil / low cost
© R.P. da Silva et al., Published by EDP Sciences 2025
 This is an Open Access article distributed under the terms of the Creative Commons Attribution License (https://creativecommons.org/licenses/by/4.0), which permits unrestricted use, distribution, and reproduction in any medium, provided the original work is properly cited.
1 Introduction
Despite advances in radiological protection, the need to monitor environmental radiation to ensure the protection of the population is increasingly evident, whether due to nuclear accidents (such as Chernobyl and Fukushima), radiological accidents (such as those in Goiânia, Brazil, or Ciudad Juarez, Mexico), mining effluents, to prevent acts of terrorism, in medical procedures or even due to the Earth’s own natural exposure (Koyama et al., 2010). Nuclear facilities typically have requirements to monitor radiation levels, but these are usually limited to static sensors located close to the reactor, designed to detect small leaks. Researches realized that neither atmospheric dispersion models nor observations alone could provide the comprehensive picture needed for operational needs. Therefore, alternative backup monitoring systems must be in place in areas at risk of nuclear incidents resulting from complex disasters (Koyama et al., 2010).
Earth system models and environmental data can be integrated to improve the spatiotemporal analysis, so that environmental monitoring can produce relevant observational data on a large scale, which can be used by governments, academics and industry (Hultquista and Cervonea, 2019). In this sense, some countries have already implemented environmental monitoring networks. Germany, for example, has a network of more than 1,800 fixed monitoring stations equipped with Geigers detectors. Europe as a whole has a network of more than 5,000 monitoring stations (Souza, 2017). Another example is the Internet of Things (IoT) that was developed for environmental radiation monitoring at the European Organization for Nuclear Research (CERN) based on a low-power wide area network (LPWAN). The proposed system, called Residual Radiation Monitoring (W-MON), consists of an interconnected network of thousands of gamma radiation sensors acting as long-range transceivers (LoRa). The end devices continuously measure radiation levels in the waste containers and periodically send the data to the LoRaWAN network, covering hundreds of hectares (Manzano et al., 2021).
Furthermore, it may be possible to incorporate data collected by citizens in the area of interest. Thus, the use of sensors for monitoring environmental radiation is a current practice, and often linked to the issue of Citizen Science (Koyama et al., 2010; Brown et al., 2016; Rochedo et al., 2013; Hultquista and Cervonea, 2019; Manzano et al., 2021). Citizen Science (CS) can be seen as a process of rapprochement between science and society, where CS can help to collect good-quality scientific data and extend the spatial or temporal coverage of researchers, especially in terms of working in contexts with limited human access or financial resources, improving the flow of information between scientists, the public, and decision-makers (Kawabe et al., 2022).
So, CS for environmental monitoring is a growing movement that is spurred on by technologies that enable the mass collection of geolocated data (Hultquista and Cervonea, 2019). In this regard, some types of personal dosimeters were developed not only for personal monitoring but also for environmental radiation monitoring. For example, a thermoluminescence dosimeter (TLD) and Passive dosimeters (optically stimulated luminescence meter − OSL and a direct ion storage − DIS) have also been tested to monitor environmental radiation (Koyama et al., 2010). Another example are smartphones developed into geolocated multi-task assistants, where an infinity of applications related to healthcare and the environment has emerged. Measuring environmental quality is a major focus of interest (air quality outdoors, indoors, in different environments, etc.) and websites and applications have been developed to make the data collected by public bodies available.
So, in recent years, CS projects with the development of Apps and sensors began to use smartphones to collect data in nuclear area. Some of these devices only indicate the presence of radiation, while others are capable of transmitting the readings via a wireless connection to the user’s smartphone, which associates them with georeferenced data and retransmits them to a central. The use of free software applied to different projects is also highlighted, contributing to lower their cost (Odenwald, 2019; Oliver et al., 2019;Sunny et al., 2020; Ramos and Razuck, 2021). Furthermore, a mobile air quality monitoring system using low-cost sensors deployed in routine vehicle fleets has already been used for the continuous detection of pollutant variations (De Souza et al., 2020). Given the increasing popularity of this new participatory science, the French Institute for Radiological Protection and Nuclear Safety (IRSN), the French Institute of Instructors in Major Risks and Environmental Protection (IFFO-RME), Planète Sciences and the FabLab of the Sorbonne Universities have created a website to collect dose rate measurements made by citizens in the environment, called the OpenRadiation project.
A dosimetry Appy for smartphones, combined with an external dosimeter, has been developed for taking measurements and sending them to the OpenRadiation database. The dosimetric quantity measured is the ambient dose equivalent rate given in μSv per hour. Every measurement is accompanied by around fifty metadata designed for data analysis (geolocation, start/end of measurement, type of detector, type of telephone, etc.) while others are entered by the user (indoors/outdoors measurement, weather conditions, etc.). Furthermore, different types of dosimeter can be used with the app: a kit version to be assembled by yourself or certain off-theshelf models (Bottollier-Depois et al., 2019).
Yet another study emerged in post-Fukushima Japan, where citizens generated their own radiation data and measurement devices to provide the public with actionable data about the environment. CS data from the Safecast project has been shown to provide a reliable estimate of the spatial distribution of high-level radiation concentrations around Fukushima when compared with government data. The advantage of contributed data over government data is that it is collected over a longer period of time and has greater spatial coverage (Hultquista and Cervonea, 2019). Safecast is a CS project focused on measure ambient dose rates around the world, of freely accessible. Currently more than 120 million observations have been used to calculate average values of equivalent dose rates in 330 cities around the world. The results mainly reflect the dose rate of terrestrial radiation, the variability of which is controlled by geochemistry, i.e., by the concentrations of uranium, thorium and potassium. The results are presented in tables, graphs and maps. The platform has enabled the creation of a global ambient equivalent dose rate (ADER) map through contributions from several citizens, still expanding, who submit data acquired using a standard monitor, the bGeigie nano, where the data and methodology are openly accessible (Bottollier-Depois et al., 2019; Bossew et al., 2020).
Specifically with regard to Brazil, there are no systematic radiometric surveys for the Brazilian territory whose ultimate goal is to determine the dose rate, exposure rate or air kerma rate, quantities that could be used to calculate the external dose to which the Brazilian population is exposed. Not only does Brazil not have a radiological survey of the subsoil of its entire territory, but only a small fraction of the urban environment has been monitored and, above all, the country does not have a network of monitoring stations (Souza, 2017).
Therefore, the objective of this paper is to present a system that consists of an alternative way of monitoring environmental radiation, based on a device that can be installed in vehicles that travel routes according to their own operational needs, thus presenting itself, as in other studies, as a low-cost practice, as found in “citizen science” initiatives, since it can be adapted to any type of vehicle. This papaer presents an innovation in the form of data acquisition, associating the low cost of the detector, capable of performing radiological readings, temperature, humidity, atmospheric pressure, where according to the georeferenced positioning, the information is transmitted via the mobile phone network and made available for online access.
2 Materials and methods
2.1 The monitoring device
The monitoring system used is a mobile station that is composed of three main modules (Fig. 1), in addition to a power source, which is a 5 milliampere (mA) battery with a duration of 3 days, which can also be connected to the car’s USB output (Figs. 2a and 2b):
- a)
a Geiger Muller detector;
- b)
a module with a temperature, humidity and atmospheric pressure sensor; and
- c)
a communication module, consisting of a microcontroller associated with a mobile phone chip and Global Positioning System (GPS).
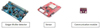 |
Fig. 1 Modules comprising the monitoring device.Source: The author. |
 |
Fig. 2 a. Low-cost equipment developed for monitoring. It is possible to see the basic system and compare it to a key to get an idea of the real size. b. Low-cost equipment developed for monitoring. The final assembly of the equipment.Source: The author. Source: The author. |
2.2 The telecommunication module
The adopted control and telecommunications module integrate a SAMD21 microcontroller with an A9G GPRS/GSM/GPS module operating at frequencies (850MHz, 900MHz, 1.8GHz, 1.9GHz). The SAMD21 microcontroller performs counting of the signals/interruptions generated by the Geiger counter and, according to a predetermined time interval (15 s), closes the counting. A program was developed in C++ language so that this microcontroller can perform counting and georeferencing analyses, transmitting the data via the telephone network to a virtual computer in the cloud.
This computer is active, with internet access 24 h a day, 7 days a week, receiving data. After a first treatment, this computer makes the data available for georeferenced access, being able to issue alerts directly to the cell phones of the people of interest, when necessary. All communication with the GSM network is carried out using AT commands. AT commands are a set of commands that allow GSM devices/terminals to communicate with the GSM network and follow the GSM 07.07 specification.
Then, through AT commands, it obtains GPS coordinates from the A9G module and assembles a package containing the date, time, counts, coordinates, temperature, humidity, and pressure. Once again, using AT commands, this package is sent by the A9G module to the mobile telephony network. The transmission of the information package is based on the MQTT protocol. The Message Queue Telemetry Transport (MQTT) is a very lightweight and flexible protocol, and is very suitable for this use. The communications module assembles packets containing one or more readings, each packet includes the station identification, the readings, and the positioning time (Fig. 3).
The part of the computer that receives the sent data is also already operational. A remote machine was configured in the Amazon Web Services (AWS) cloud and a program was developed in Python, which has the advantage of being active 24 h a day, 7 days a week, and never has an internet connection. The program that performs post-processing of the data was developed in Fortran.
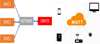 |
Fig. 3 Diagram of data transmission through the mobile telephony network.Source: The author; Taobao, 2024. |
2.3 The calibration system
The equipment calibration was performed using the IRD’s own Large Planar Sources (Fig. 4), comparing the results with those of the Eberline-600.
The detector calibration unit for in situ gamma spectrometry in Brazil is installed at the IRD and is a FIXED PORTABLE model. The system consists of 8 concrete discs measuring 3 meters in diameter and 50 cm deep and a central disc measuring 4 meters in diameter and 70 cm deep.
The sources were built with a mixture in the proportion of one part CP-320 cement, two parts No. 1 gravel and three parts sand (ratio 1:2:3). The detectors were also calibrated with the IRD planar source system at 3 heights: in contact with the source or at zero cm, 10 cm and 1 meter high. Due to the size of the SPARCS system pod, the geometric center of the pod was aligned with the center of the planar source, considering the distance from the surface to the bottom of the pod.
The accuracy of the equipment can be verified according to the results for 4 prototypes with the U2 source. A total of 20 readings at different heights in relation to the ground were averaged and compared with the Ederline-600 reading and the calibration factor was calculated (Fig. 5).
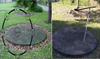 |
Fig. 4 The IRD planar source system for in situ calibration of gamma spectrometers. The Figure shows a planar source and, superimposed, the graphical scheme of the eight sources arranged around the pool, in the center of a circle.Source: The author. |
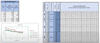 |
Fig. 5 Calibration of prototypes using the U2 source.Source: The author. |
3 Results and discussion
Initially, the proposed system was tested in a preliminary study, in which more than 25,000 readings accumulated over a period of approximately 15 days were collected. Since the system is already operational, even if not yet fully operational, a set of 180,000 readings has already been collected.
The post-processing program groups the various readings from the same location, filtering and calculating the average value, standard deviation, etc. The preliminary results demonstrate the applicability and full potential of the proposed system, as shown in Figure 6. Readings are presented in counts per minute (com.).
Initially, regular mobile telephony chips from two major nationwide operators were used. However, during the tests, it was observed that as the vehicle moved, there were frequent losses of connection with the mobile network, and reconnecting to the network was often challenging.
To overcome this difficulty, the adopted solution was to use a list of Access Point Names (APNs) composed of APNs from nationwide operators. If the microcontroller fails to establish a connection with one APN, it attempts to connect to the next one on the list, and so on. This solution showed improvement but still presented some problems.
Later, the issue of private APNs dedicated to Machine-to-Machine (M2M) or IoT communication was considered. Three types of M2M communication chips were tested, including a multi-operator M2M chip, a LinkField chip, and a chip linked specifically to one of the major operators, with the following results:
Multi-operator M2M chip − The device connected, sent a packet of readings, then lost the connection, and could only reconnect after a few minutes, resulting in unsatisfactory performance;
LinkField M2M chip − The device failed to establish communication; and
M2M chip from a specific operator − This chip worked well and achieved good results.
It is important to note that these results are specific to the equipment used, and other devices may yield different results. Based on the achieved results, the decision was made to use a private APN through a chip from a virtual M2M operator.
After the system was calibrated and adjusted, a new set of readings was taken in the city of Rio de Janeiro (Fig. 7).
Figure 8 compare the results obtained with a commercial device and the results obtained by the device developed with the final calibration, respectively.
As this is still a pilot and preliminary study, all the measurements presented here were obtained with the device in a car. Readings are presented in counts per minute (com.). The readings obtained were 3.33 nSv/min (average) in commercial device and 3.41 nSv/min (average) in developed device.
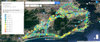 |
Fig. 6 Dataset collected in a 15-day pilot study.Source: The author. |
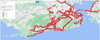 |
Fig. 7 Dataset collected after calibration.Source: The author. |
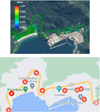 |
Fig. 8 Comparation between the commercial device and the device developed with the final calibration, respectively.Source: The author. |
4 Conclusion
This paper presents the implementation of an interconnected network of gamma radiation sensors for an environmental radiation monitoring system. The devices were in a car during the tests. Results showed that all areas where the devices are placed have a high coverage range with low interference and packet lost.
The use of this device in vehicles would allow the same device to measure thousands of points per day along a route, as well as to take several readings from the same location over time, as the vehicle repeated the route. This system would be fully applicable to Brazil, considering that due to the territorial extension and budget restrictions. The use of a system along the lines of the German or the European, for example, would be practically unfeasible, in view of the costs for installation and mainly for maintenance.
This would be possible because the coverage of the existing mobile telephony network in Brazilian cities and roads encompasses over 2,000 cities, and approximately 50% of the federal paved road network is covered. Additionally, there are contracts in place for the installation of coverage in practically the entire remaining federal paved road network. Considering that mobile network coverage is better in densely populated areas, and the road network is denser in those regions as well, monitoring systems of this nature already present significant potential and are likely to become even more efficient. Although there are still many areas without mobile network coverage, the trend is for these areas to decrease rapidly.
And this dataset would allow a continuous radiological survey/monitoring that would otherwise be extremely costly and difficult to implement in a country like Brazil. As noted, the system even in a preliminary character already shows all its potential. At the moment, details are being worked on regarding data filters to be presented in the visualization of results, as well as on treatments related to measurements of the same location at different times.
While one advantage is the use of third-party fleet vehicles, which are non-dedicated and travel long distances daily, it also leads to a certain diversity of vehicles and variations in coverage quality, including areas with good coverage, poor coverage, or no coverage, as well as switching between different mobile operators during the same trip.
The system under consideration, still in testing and not yet completed, already shows sufficient efficiency to demonstrate its full potential, with readings permeating increasingly through city streets and extending to more distant regions. Although less frequent, there are still situations in which the device loses connection and cannot reconnect. In these cases, the solution seems to be the implementation of a watchdog algorithm, which aims to monitor the system’s functioning and restart it if a certain cycle takes much longer than expected. This algorithm is already under implementation.
Another aspect yet to be implemented is the retransmission of readings that were not sent due to a lack of connection. For example, if the device loses connection on a road due to coverage issues, as soon as it reconnects, it will transmit all the data that was not sent in the previous section.
In this case, the device is self-sufficient in itself to take all the readings and send them via the mobile telephone network, depending only on energy provided by a battery or the vehicle, dispensing with any user interference. These stations would not be in vehicles for exclusive or specific use, but in vehicles that routinely travel long distances, such as buses, trucks, taxis, vehicles linked to public agencies or service providers.
While one advantage is the use of third-party fleet vehicles, which are non-dedicated and travel long distances daily, it also leads to a certain diversity of vehicles and variations in coverage quality, including areas with good coverage, poor coverage, or no coverage, as well as switching between different mobile operators during the same trip.
The issue of coverage was one of the first problems identified during the development of the project. Often, when the device traveled through an area with no signal, it couldn’t reconnect even after reaching an area with good coverage.
The difficulty of working with mobile air quality monitoring data arises from the combination of complex spatiotemporal sampling and temporal air quality variability in different locations, related to traffic dynamics, street topology, meteorology, background source strength, etc. Thus, in future studies these measurements need to be supplemented by other scheduled or non-scheduled vehicles that operate at different hours to obtain truly representative pollution values over the region.
Funding
The authors received no financial support for the research.
Conflicts of interest
All authors declare that they have no conflicts of interest.
Data availability statement
The data that support the findings of this study are available from the corresponding author, Z. TAHIRI, upon reasonable request.
Author contribution statement
All authors contributed to the design and implementation of the research, to the analysis of the results and to the writing of the manuscript.
References
- Bossew P, Kǔca P, Helebrant J. 2020. Mean ambient dose rate in various cities, inferred from Safecast data. J Environ Radioact 225. [Google Scholar]
- Bottollier-Depois J, Allain E, Baumont G, Berthelot N, Darley G, Ecrabet F, Jolivet T, Lebeau-livé A, Lejeune V, Quéinnec F, Simon C, Trompier F. 2019. The OpenRadiation project: monitoring radioactivity in the environment by and for the citizens. Radioprotection, 54 (4): 241–246. [CrossRef] [EDP Sciences] [Google Scholar]
- Brown A, Franken P, Bonner S, Dolezal N, Moross J. 2016. Safecast: successful citizen-science for radiation measurement and communication after Fukushima. J Radiol. Prot 36: S82. [CrossRef] [PubMed] [Google Scholar]
- De Souza P, Anjomshoaa A, Duarte F, Kahn R, Kumar P, Ratti C. 2020. Air quality monitoring using mobile low-cost sensors mounted on trashtrucks: methods development and lessons learned. Sustain Cities Soc 60: 102239. [CrossRef] [Google Scholar]
- Hultquista C, Cervonea G. 2019. Comparison of simulated radioactive atmospheric releases to citizen science observations for the Fukushima nuclear accident. Atmos Environ 198: 478–488. [CrossRef] [Google Scholar]
- Kawabe L, Ghilardi-lopes N, Turra B, Wyles K. 2022. Citizen science in marine litter research: a review. Mar Pollut Bull 182. [Google Scholar]
- Koyama S, Miyamoto Y, Fujiwara A, Kobayashi A, Ajisawa K, Komori H, Takei Y, Nanto H, Kurobori T, Kakimoto H, Sakakura M, Shimotsuma Y, Miura K, Hirao K, Yamamoto T. 2010. Radiation monitoring utilizing solid state dosimeters. Sens Mater 22 (7). [Google Scholar]
- Manzano L, Boukabache H, Salvatore D, Heracleous N, Murtas F, Perrin D, Pirc V, Alfaro A, Zimmaro A, Silari M. 2021. An IoT LoRaWAN network for environmental radiation monitoring. IEEE Trans Instrum Meas 70. [Google Scholar]
- Odenwald S. 2019. Smartphone sensors for citizen science applications: radioactivity and magnetism. Citizen Sci: Theory Practice 4 (1): 18. [CrossRef] [Google Scholar]
- Oliver K, Benoit M, Muller A, Schmeling S. 2019. Smartphone and tablet-based sensing of environmental radioactivity: mobile low-cost measurements for monitoring, citizen science, and educational purposes. Sensors 19: 4264. [CrossRef] [PubMed] [Google Scholar]
- Ramos M, Razuck F. 2021. Elaboration of an App for calculations of dosimetric quantities aiming at radiological protection. J Phys Conf Ser 1826: 012043. [CrossRef] [Google Scholar]
- Rochedo E, Salles K, Prado N. 2013. Assessment of the external exposure of the Brazilian population to natural background radiation. IX Latin American IRPA Regional Congress on Radiation Protection and Safety. IRPA. [Google Scholar]
- Souza, E. 2017. Rastreamento gama terrestre: estimativa da exposição da população à radioatividade em áreas urbanas. Tese (Doutorado). Instituto de Radioproteção e Dosimetria (IRD). Rio de Janeiro. [Google Scholar]
- Sunny A, Zhao A, Kanteh S. 2020. Low-cost IoT-based sensor system: a case study on harsh environmental monitoring. Sensors (Basel) 21 (1): 214. [CrossRef] [PubMed] [Google Scholar]
- Taobao. Available at: https://vn.world.taobao.com/item/774996919333.htm?spm=a21wu.24122187.recommend-goods.5>. last accessed on: 11/01/2024. [Google Scholar]
- Viana B, Souza C, Moreira E. 2020. Why the views of latin American scientists on citizen science as a tool for pollinator monitoring and conservation matter? Neotrop Entomol, Aug. [PubMed] [Google Scholar]
Cite this article as: da Silva RP, de Souza EM, Razuck FB, de M. Ferreira AC. 2025. A low-cost environmental radiation monitoring system implemented in Brazil. Radioprotection 60(2): 195–202. https://doi.org/10.1051/radiopro/2024052
All Figures
|
Fig. 1 Modules comprising the monitoring device.Source: The author. |
| In the text | |
|
Fig. 2 a. Low-cost equipment developed for monitoring. It is possible to see the basic system and compare it to a key to get an idea of the real size. b. Low-cost equipment developed for monitoring. The final assembly of the equipment.Source: The author. Source: The author. |
| In the text | |
|
Fig. 3 Diagram of data transmission through the mobile telephony network.Source: The author; Taobao, 2024. |
| In the text | |
|
Fig. 4 The IRD planar source system for in situ calibration of gamma spectrometers. The Figure shows a planar source and, superimposed, the graphical scheme of the eight sources arranged around the pool, in the center of a circle.Source: The author. |
| In the text | |
|
Fig. 5 Calibration of prototypes using the U2 source.Source: The author. |
| In the text | |
|
Fig. 6 Dataset collected in a 15-day pilot study.Source: The author. |
| In the text | |
|
Fig. 7 Dataset collected after calibration.Source: The author. |
| In the text | |
|
Fig. 8 Comparation between the commercial device and the device developed with the final calibration, respectively.Source: The author. |
| In the text | |
Current usage metrics show cumulative count of Article Views (full-text article views including HTML views, PDF and ePub downloads, according to the available data) and Abstracts Views on Vision4Press platform.
Data correspond to usage on the plateform after 2015. The current usage metrics is available 48-96 hours after online publication and is updated daily on week days.
Initial download of the metrics may take a while.