")
")
| Issue |
Radioprotection
Volume 60, Number 2, Avril-Juin 2025
|
|
|---|---|---|
| Page(s) | 125 - 133 | |
| DOI | https://doi.org/10.1051/radiopro/2024047 | |
| Published online | 13 June 2025 | |
Article
National diagnostic reference levels (DRLs) for general and interventional radiography, mammography, and CT scan based on the latest surveys in Iran
1
Nuclear Engineering Department, School of Mechanical Engineering, Shiraz University, Shiraz, Iran
2
Radiation Research Center, School of Mechanical Engineering, Shiraz University, Shiraz, Iran
3
Iran Nuclear Regulatory Authority (INRA), Tehran, Iran
4
Department of Medical Physics and Biomedical Engineering, Faculty of Medicine, Shahid Beheshti University of Medical Sciences and Health Services, Tehran, Iran
5
Radiation Sciences Department, Faculty of Allied Medicine, Iran University of Medical Sciences, Tehran, Iran
6
Secondary Standard Dosimetry Laboratory (SSDL), Pars Isotope Co., Karaj, Iran
* Corresponding author: This email address is being protected from spambots. You need JavaScript enabled to view it.
Received:
2
July
2024
Accepted:
7
October
2024
Abstract
Establishing Diagnostic Reference Levels (DRLs) is crucial for optimizing patient radiation protection during diagnostic imaging procedures. This study aims to develop national DRLs for diagnostic radiology in Iran, based on a comprehensive retrospective analysis of previous research projects, and studies. Necessary information was gathered from various data, including research project reports, graduate theses, and articles published in scientific journals, or presented in national and international conferences. After initial data validation, DRL values were established by detailed analysis. DRLs were established for various anatomical locations including the four main imaging modalities, e.g., radiology, computed tomography (CT), mammography, and interventional radiology. For instance, the DRL for radiology abdomen imaging was set at an entrance surface dose (ESD) of 3.29 mGy, while for CT head imaging, the DRL was a CTDIvol of 49 mGy. The NDRL values in Iran showed some variability in Comparison with the DRLs from other countries. This underscores the need for the establishment of natural DRLs. The study highlights the importance of cooperative efforts among academic and research institutions for updating the DRL values. This study provides national DRL for radiological imagings, contributing to the global effort in radiological protection.
Key words: diagnostic imaging / radiation protection / imaging modalities / diagnostic reference levels
© S. Sina et al., Published by EDP Sciences 2025
 This is an Open Access article distributed under the terms of the Creative Commons Attribution License (https://creativecommons.org/licenses/by/4.0), which permits unrestricted use, distribution, and reproduction in any medium, provided the original work is properly cited.
1 Introduction
Due to the increasing use of diagnostic radiation imaging, monitoring the dose received by patients while performing these tests has been increasing in the last decades (Wall and Shrimpton, 1998; Neofotistou et al., 2003; ICRP, 2007; Faulkner et al., 2008; Padovani et al., 2008). The term ‘Diagnostic Reference Levels’ (DRLs) was first introduced in publication No. 73 of the International Commission on Radiological Protection (ICRP) (ICRP, 1996). ICRP defines the DRL as an information-level tool for data optimization.
The concept of DRLs has evolved significantly over the years. Initially introduced to address the variability in patient doses during diagnostic imaging procedures, DRLs have become a cornerstone of dose optimization practices. Given the increasing use of diagnostic radiology examinations, it is essential to monitor and control the doses received by patients during these tests and implement guidelines and recommendations to optimize patient doses in line with the As Low As Reasonably Achievable (ALARA) principle. It means that to achieve optimal safety levels for patients undergoing X-ray examinations, patient doses must be kept as low as reasonably achievable, while maintaining diagnosis objectives.
International, and national organizations, including the International Atomic Energy Agency (IAEA), ICRP, the Institute for Radiation Protection and Nuclear Safety (IRSN) of France, the United States Environmental Protection Agency (EPA), Australian Radiation Protection and Nuclear Safety Agency (ARPANSA), and the National Radiation Protection Department of the Atomic Energy Organization of Iran (NRPD), have addressed this crucial issue. International organizations have provided frameworks and guidelines that assist countries in developing their DRLs and ensuring consistency in radiological protection practices worldwide.
National DRL values are currently obtained as the third quartile of median dose values (rather than mean values) for a sample of representative medical imaging centers, Based on the ICRP publication 135 (ICRP, 2017).
National diagnostic reference levels, NDRLs, have been established in different countries, for different diagnostic imaging (Salama et al., 2017; Ferderbar et al., 2019; Rawashdeh et al., 2019; Abuzaid et al., 2020; Alsufi, 2020; Khelassi-Toutaoui et al., 2020; Kanda et al., 2021; Masoomi et al., 2021; Peter et al., 2021; Abdou et al., 2022; Hakme et al., 2023; HIQA, 2023; IRSN, 2023).
Iran is ranked as the 18th largest country in the world in terms of area at 1,648,195 square kilometers. In Iran, diverse population distribution in geographical regions, and at the same time, unequal economic structure development, present unique challenges in radiation optimization in diagnostic radiology. The extensive land area, coupled with a diverse population, necessitates the establishment of national DRLs to ensure optimal radiation protection for patients across different regions. In this country, various academic societies, organizations, and researchers have measured diagnostic doses in different provinces. However, these measurements are mostly independent and not done with sufficient cooperation between these groups (Asadinezhad and Bahreyni Toossi, 2008; Norooz Alizadeh et al., 2011; Bahreyni et al., 2013 Bahreyni Toossi et al., 2013; Gholami et al., 2015; Najafi et al., 2015; Toori et al., 2015; Niksirat et al., 2016; Hosseini Nasab et al., 2017; Rasuli et al., 2017; Mohsenzadeh et al., 2018; Sohrabi et al., 2018; Zarghani and Bahreyni, 2018; Asadinezhad et al., 2019; Afzalipour et al., 2019; Aliasgharzadeh et al., 2021; Tabesh et al., 2021; MirDerikvand et al., 2023). Therefore, no national DRL for medical imaging has been proposed so far. The objective of this retrospective study is to establish the national DRL based on the results of the latest domestic research.
2 Materials and methods
This research is based on a retrospective study, involving meticulous analysis of the results of previous studies, and research projects concerning DRL values, mostly for the last 7 yr. To conduct this retrospective study and extract DRL values, several stages were implemented.
Before reviewing the previous studies, a consultative expert meeting was held to define the inclusion and exclusion criteria for incorporating previous research into the current study. The criteria selected were: studies conducted on adult patients (18 yr and older); studies conducted on patients with normal weights (50–90 kg), excluding very fat or very thin patients; studies on frequent and high-dose procedures; and studies with appropriate geographical distribution across the country, compared to the distribution of the medical imaging systems in the country. Figure 1a shows the map of Iranian provinces, and Figures 1b and 1c show the distribution of digital radiology systems in various provinces in Iran as two examples of the geographical distribution of different medical imaging systems. The unequal distribution of medical imaging devices is obvious from the figure. Based on the information obtained from the Atomic Energy Organization of Iran (AEOI), more than 32% of the radiology systems are located in the medical centers of Tehran province.
An extensive review of previous research was conducted, with articles and studies obtained from various platforms. This included articles presented at national and international conferences, articles published in scientific journals, reports of previous research projects, and relevant theses and dissertations. After collecting these materials, the first stage of data validation was performed. This stage involved refining the data, removing outliers and invalid data, and documenting the reasons for their removal.
The collected data were analyzed after the initial review and validation to determine the DRL values. This process involved reviewing and validating the quality of studies and their adherence to the defined criteria, excluding studies that did not meet the necessary conditions, and conducting a detailed analysis of the remaining data to determine DRL values. The comprehensive and accurate determination of DRL values, which are essential for optimizing patient dose management in diagnostic medical imaging, was made possible by this systematic approach.
Before the publication of the ICRP-135 recommendations in 2017, the investigators used the 75th percentile of the mean values for a sample of representative medical imaging centers for obtaining diagnostic reference levels. In 2017 the use of median values was recommended instead of mean values, as the mean values are highly affected by the outlier data points.
Unfortunately, a large number of investigations reviewed in this study reported the mean and the third quartile values. As there was not enough information about the median values in all studies, the old method, (i.e., Q3 of the distribution of the mean values of the appropriate DRL quantity observed at each healthcare facility) was used for establishing the DRL values. Meanwhile, the raw data was available for some investigations used for the establishment of the DRL. To reduce the effects of the very high, or very low data points on the DRL values, we deleted the outlier data, from such data, and the mean values for these studies were obtained without the effect of the outlier data points on the results. Finally, the third quartile of the mean values were obtained, and reports as the DRL.
We utilized AI-based tool (Chatgpt4O) for language editing and grammar corrections to enhance the clarity and accuracy of the manuscript.
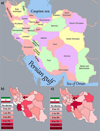 |
Fig. 1 a) map of Iranian provinces. Geographical distribution of b) digital radiology systems, and c) conventional radiology in various provinces in Iran. |
3 Results
3.1 Screening of mammography studies
In the initial screening phase for mammography studies, 20 studies met the basic entry criteria. After a detailed examination of abstracts and results, five studies were excluded as they focused solely on simulation for calculating the mean glandular dose (MGD). A secondary review of 16 studies led to the exclusion of two systematic reviews and four studies lacking patient dose data. As shown in Figure 2, This left 10 studies for final analysis, representing data from 10 provinces, encompassing 73.4% of the mammography devices. The data were used for proposing the DRL values for Mamography. The DRL values were shown in Table 1.
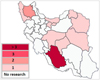 |
Fig. 2 Geographic distribution of measurements taken for mammography imaging in different provinces. |
National DRL values for different imaging.
3.2 Screening of general radiography studies
In the second phase, focusing on general radiology, data were gathered from 25 articles, theses, and research projects related to the topic. Exclusions were made for various reasons: one article was excluded due to improper differentiation of data, such as failing to distinguish between different imaging modalities; another was excluded due to insufficient information provided by the authors to determine DRLs. Additionally, one article that calculated doses through simulation and another with discrepancies between the reported data and the data required for determining DRLs were also excluded. After these exclusions, 21 articles were finalized for data extraction. A sample example of general radiography is illustrated in Figure 3. The dataset includes information from 29 provinces, covering 97.6% of the radiology devices. The distribution of ESD values in general radiology across different Iranian regions shows a normal distribution with slight skewness in some imaging views, such as lateral lumbar radiography. Such outliers could benefit the dose optimization strategies by using the NDRL.
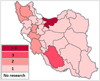 |
Fig. 3 Geographic distribution of measurements taken for abdomen radiology imaging in different provinces. |
3.3 Screening of CT scan studies
In the third phase, which focused on CT studies, an extensive collection effort yielded 67 related articles, theses, and research projects. Several exclusions were necessary during this phase: two investigations were removed due to duplicate data; two others used dose calculations via simulation; seven articles focused on dual-modality imaging (e.g., SPECT-CT), which were not suitable for our analysis; and nine studies determined organ doses, which are not applicable for establishing DRLs. This rigorous selection process left 47 investigations for final data extraction and analysis. A sample example is illustrated in Figure 4. The dataset includes information from 29 provinces, encompassing 96.2% of the CT devices. Based on the results, the distribution of CT dose values across the provinces appears normal with minimal skewness, indicating uniform practices across the country.
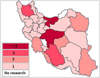 |
Fig. 4 Geographic distribution of measurements taken for abdomen/pelvis CT imaging in different provinces. |
3.4 Screening of orthopantomography studies
In the fourth phase, focusing on dental OPG (orthopantomography), 10 related articles, theses, and research projects were reviewed. Parameters such as Dose Area Product (DAP) were considered in this review. However, eight articles were excluded for including unrelated parameters such as ESD, Dose Width Product (DWP), and organ doses. Consequently, only two articles remained relevant for the final analysis.
3.5 Screening of interventional radiology studies
In the fifth phase, which focused on interventional radiology, 11 related articles, theses, and research projects were collected. One article was excluded due to lack of access to the mentioned data, leaving 10 articles to proceed to the final review and data extraction stage.
The dataset includes information from two provinces, accounting for 8% of the dental OPG devices, which is not a good representative of the entire country, and therefore not sufficient for establishing national DRL. However, according to the publication of ICRP, the method used for establishing DRL should be flexible, and dynamic. It means that the initial DRL values can be derived from small data while waiting for wider surveys to be conducted, for updating the DRL values. Therefore, the local provincial data can be used until further studies are performed.
3.6 Comparison of NDRLs in Iran with other countries
The national DRL values established for various imaging modalities in Iran are summarized in Table 1. These values were compared with international standards from countries such as Japan, the UK, Ireland, and France (Tabs. 2–4).
The national DRL values for mammography in Iran, specifically the MGD, are 1.58 mGy for the MLO view and 1.49 mGy for the CC view. When compared to international standards, these values are lower than those reported in the UK and Ireland but slightly higher than in Japan.
The NDRL values for Entrance Surface Dose (ESD) values in radiology imaging in Iran were compared with those from Japan, the UK, and other countries. For example, the national diagnostic reference level of the ESD for abdominal radiography in Iran is found to be 3.29 mGy, which is higher than that of Japan (2.5 mGy) but lower than the DRL reported for the UK (4 mGy).
The national DRL values for CT dose indicators, such as CTDIvol and DLP, were compared to those from the UK, Ireland, Japan, and France. For instance, the NDRL for CTDIvol for abdomen/pelvis CT in Iran is 11.78 mGy, which is comparable with those of France, and the UK, but lower than the DRL of Japan. The NDRL values for the DLP are generally comparable with other countries. The local DRL for Fars province was found to be 157.56 mGy.cm2, and 99.7 mGy.cm2 For Yazd province. Such value was reported as 81 mGy.cm2 in the UK.
The cause of the differences in the DRL values may be because of the difference in imaging techniques used by the technologists, and the difference in medical imaging devices. One of the possible causes of such difference may be the method used for obtaining the DRL values, (this study is based on the mean values, while other recent studies).
Comparison of DRLs for Entrance Surface Dose (ESD) in mGy.
Comparison of DRLs for CTDIvol and DLP in CT imaging, expressed in mGy.cm and mGy.
Comparison of DRLs for Mean Glandular Dose (MGD) in mammography, expressed in mGy.
3.7 The distribution of the patients’ dose
The results show that patients in different diagnostic procedures receive a variety of doses. This may depend on several reasons, like different imaging techniques, personnel skills, and medical imaging equipment. Figures 5a–5c show the box plot showing the distribution, i.e., minimum, lower quartile, median, upper quartile, and maximum values, of the patient dose values for some of the imaging modalities in different facilities for determination of the DRL.
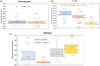 |
Fig. 5 Distribution of the dose values in different imaging modalities. |
4 Discussion
The primary objective of establishing national DRLs is to enhance patient safety by optimizing radiation doses during medical imaging procedures. Setting these benchmarks helps us ensure that the radiation doses administered are kept as low as reasonably achievable (ALARA), while still providing the necessary image quality for accurate diagnosis.
In this study, a comprehensive retrospective study was performed for the establishment of national diagnostic reference level, NDRL values in general, and interventional radiology. This study represents a significant step forward in the optimization of the dose values received by patients in Iran, addressing the national reference levels that account for the unique demographic and geographic factors present in the country.
The overall data distribution for DRLs in Iran shows a predominantly normal distribution with some skewness in a few modalities, like the lateral lumbar, lateral skull, and lateral thoracic imaging. Additionally, regional analysis revealed a few outliers, particularly in provinces with fewer devices or less frequent data reporting, indicating potential areas for further investigation and improvement.
Our findings revealed that the national DRL values established in this study are generally in line with the DRLs in other countries, though some variations were noted. For instance, the NDRL of MGD for mammography in Iran is slightly higher than in Japan but lower than in the UK and Ireland. Similarly, the DRL for the entrance skin dose values for general radiography and the CTDIvol for CT scans in Iran show some variability when compared to other countries. These differences underscore the importance of developing national DRLs that reflect the specific practices and technologies used within each country.
The establishment of DRLs not only serves as a tool for dose optimization but also as a catalyst for improving overall imaging practices. By identifying regions or modalities where dose levels are higher than necessary, targeted interventions can be implemented to reduce these doses without compromising diagnostic efficacy. For example, our study identified certain regions with outliers in dose values, indicating areas where further investigation and potential corrective measures are warranted.
The National Radiation Protection Department of the Atomic Energy Organization of Iran is developing an action plan for updating and implementing of the National DRL values in the optimization of patient Imaging. National guidelines will be established for the investigators in the medical imaging centers, on determination, and reporting of patient doses, ensuring uniformity across all imaging centers. This standardization is essential for the reliable updating of the national, and local DRL data over time, based on the recommendations of the ICRP 135, and using median values. The action plan will be twofold: it aims to improve the accuracy and consistency of data collection for DRL determination and to help optimize imaging practices across the country.
Furthermore, the action plan includes initiatives to train medical staff on best practices in radiation protection, ensuring that they are well-informed about the importance of dose optimization and the role of DRLs in achieving this goal. By fostering a culture of safety and continuous improvement, these efforts will contribute to the long-term enhancement of medical imaging practices in Iran.
5 Conclusion
In this survey, the national DRLs are proposed for mammography, Computed tomography, and general, and interventional radiography based on a retrospective study. The research revealed a significant variation in the recorded dose values in different imaging procedures in Iran. However, these discrepancies can be accounted for if incorporated into the National diagnostic reference levels. DRLs are designed to help optimize radiation exposure in medical imaging procedures. The concept of dose optimization is crucial in ensuring radiation protection during medical imaging procedures. The patient dose should not surpass what is needed for sufficient diagnostic image quality.
In addition to researchers conducting studies, research projects, and graduate theses an action plan for updating the national DRL is being developed, by the Radiation Protection Department of the Atomic Energy Organization of Iran, and will be released soon. The action plan will help ensure that DRLs are accurately updated, reported, and used, facilitating better radiation protection and dose optimization practices nationwide. By addressing the existing gaps and standardizing the DRL determination process, the country can enhance the safety and effectiveness of diagnostic radiology procedures.
Acknowledgments
This work was supported by the Iran Nuclear Regulatory Authority.
Funding
This work was financially supported by the Iran Nuclear Regulatory Authority.
Conflicts of interest
The authors declare that they have no conflict of interest.
Data availability statement
The research data associated with this article are included within the article.
Author contribution statement
S. Sina, H. Karimi Ashtiani, M. Bahreinipour, Z. Rakeb, M.H. Sadeghi, M.A. Nazari Jahromi, B. Fasaie, M.R. Deevband, R. Paydar, F. Norooz Alizadeh, M.R. Ghanbarpour, E. Farajzadeh: Conceptualization, Methodology. S. Sina, M.H. Sadeghi: Writing original draft. S. Sina, M.R. Kardan: Supervision. S. Sina, M.R. Kardan, H. KarimiAshtiani, M. Bahreinipour, B. Fasaie, M.R. Deevband, R. Paydar: Writing-Reviewing and Editing.
References
- Abdou SE, et al. 2022. 2021 National diagnostic reference levels for paediatric computed tomography in Egypt. Radiat Prot Dosimetry 198: 423–433. [CrossRef] [PubMed] [Google Scholar]
- Afzalipour R, Abdollahi H, Hajializadeh MS, Jafari S, Mahdavi SR. 2019. Estimation of diagnostic reference levels for children computed tomography: a study in Tehran, Iran. Int J Radiat Res 17: 407–413. [Google Scholar]
- Aliasgharzadeh A, Khezerloo D, Farhood B, Mohseni M, Moradi H, Mortezazadeh T. 2021. Measuring the dose-width product and proposing the local diagnostic reference level in panoramic dental radiography: a multi-center study from Iran. Oral Radiol 37: 80–85. [CrossRef] [PubMed] [Google Scholar]
- Alsufi SJ. 2020. Integration of an information system to suggest a DRL model in the radiology department at Azadi Hospital in Duhok-Kurdistan Region, Iraq. J Duhok Univ 23: 101–113. [CrossRef] [Google Scholar]
- Asadinezhad M, Bahreyni Toossi MT. 2008. Doses to patients in some routine diagnostic X-ray examinations in Iran: proposed the first Iranian diagnostic reference levels. Radiat Prot Dosimetry 132: 409–414. [Google Scholar]
- Asadinezhad M, Bahreyni Toossi MT, Nouri M. 2019. Diagnostic reference levels for computed tomography examinations in Iran: a nationwide radiation dose survey. Iran J Med Phys 16: 19–26. [Google Scholar]
- Abuzaid MM, Elshami W, El Serafi A, Hussien T, McConnell JR, Tekin HO. 2020. Toward national CT diagnostic reference levels in the United Arab Emirates: a multicenter review of CT dose index and dose length product. Radiat Prot Dosimetry 190: 243–249. [CrossRef] [PubMed] [Google Scholar]
- Bahreyni Toossi MT, Zare H, Bayani Roodi S, Hashemi M, Akbari F, Malekzadeh M. 2013. Towards proposition of a diagnostic reference level for mammographic examination in the greater Khorasan Province, Iran. Radiat Prot Dosimetry 155: 96–99. [CrossRef] [PubMed] [Google Scholar]
- Bahreyni Toossi MT, Zare H, Bayani Roodi S, Hashemi M, Akbari F, Malekzadeh M. 2013. Towards proposition of a diagnostic reference level for mammographic examination in the greater Khorasan Province, Iran. Radiat Prot Dosimetry 155: 96–99. [CrossRef] [PubMed] [Google Scholar]
- Faulkner K, et al. 2008. The SENTINEL project. Radiat Prot Dosimetry 129: 3–5. [CrossRef] [PubMed] [Google Scholar]
- Ferderbar ML, Doyle TE, Samavi R, Koff D. 2019. An environmental scan of the national and provincial diagnostic reference levels in Canada for common adult computed tomography scans. Can Assoc Radiol J 70: 119–124. [CrossRef] [PubMed] [Google Scholar]
- Gholami M, Maziar A, Khosravi HR, Ebrahimzadeh F, Mayahi S. 2015. Diagnostic reference levels (DRLs) for routine X-ray examinations in Lorestan Province, Iran. Int J Radiat Res 13: 85–90. [Google Scholar]
- GOV.UK. 2022. [ARCHIVED CONTENT] National Diagnostic Reference Levels (NDRLs) from 14 June 2022. https://webarchive.nationalarchives.gov.uk/ukgwa/20220622011636/https://www.gov.uk/government/publications/diagnostic-radiology-national-diagnostic-reference-levels-ndrls/ndrl (accessed Jun. 05, 2024). [Google Scholar]
- Hart D, Hillier MC, Shrimpton PC. 2012. Doses to Patients from, Radiographic and Fluoroscopic X-Ray Imaging Procedures in the UK-2010. HPA-CRCE-034: 1-81. [Google Scholar]
- Hosseini Nasab SMB, Shabestani-Monfared A, Deevband MR, Paydar R, Nabahati M. 2017. Estimation of cardiac CT angiography radiation dose toward the establishment of national diagnostic reference level for CCTA in Iran. Radiat Prot Dosimetry 174: 551–557. [PubMed] [Google Scholar]
- Hakme M, Rizk C, Francis Z, Fares G. 2023. Proposed national diagnostic reference levels for computed tomography examinations based on clinical indication, patient gender and size and the use of contrast in Lebanon. Radioprotection 58: 113–121. [CrossRef] [EDP Sciences] [Google Scholar]
- HIQA. 2023. Guidance on the establishment, use and review of diagnostic reference levels for medical exposure to ionising radiationHealth Information and Quality Authority (HIQA). [Google Scholar]
- ICRP Publication 73. 1996. Radiological protection and safety in medicine. Ann ICRP 26(2). [Google Scholar]
- ICRP Publication 103. 2007. The 2007 recommendations of the international commission on radiological protection. Ann ICRP 37: 2–4. [Google Scholar]
- ICRP Publication 135. 2017. Diagnostic reference levels in medical imaging. Ann ICRP 46: 1–144. [Google Scholar]
- Institut de Radioprotection et de Surete Nucleaire (IRSN). 2023. Analysis of data for updating diagnostic reference levels in radiology and nuclear medicine. France. [Online]. Available: https://www.irsn.fr/sites/default/files/2023-10/IRSN_Rapport_2023-00577_NRD_EN.pdf [Google Scholar]
- Kanda R, et al. 2021. Developing diagnostic reference levels in Japan. Jpn J Radiol 39: 307–314. [CrossRef] [PubMed] [Google Scholar]
- Khelassi-Toutaoui N, et al. 2020. Adult CT examinations in Algeria: towards updating national diagnostic reference levels. Radiat Prot Dosimetry 190: 364–371. [CrossRef] [PubMed] [Google Scholar]
- Masoomi M, Al-Shammeri I, Al-Kandari L, Elrahman H, Al-Shammeri J. 2021. National diagnostic reference level (DRL) for nuclear medicine computed tomography-positron emission tomography hybrid imaging studies for Kuwait population: second phase dose audit-2019. BJR|Open 3: 20210020. [Google Scholar]
- MirDerikvand A, Bagherzadeh S, Mohammad Sharifi A. 2023. Evaluation of awareness and knowledge of CT technologist regarding diagnostic reference levels in Iran. Radioprotection 58:299–302. [CrossRef] [EDP Sciences] [Google Scholar]
- Mohsenzadeh B, Deevband MR, Pouriran R. 2018. The national diagnostic reference level in routine digital radiography examinations in Iran. Biomed J Sci Tech Res 5: 6183–6191. [Google Scholar]
- Neofotistou V, et al. 2003. Preliminary reference levels in interventional cardiology. Eur Radiol 13: 2259–2263. [CrossRef] [PubMed] [Google Scholar]
- Niksirat F, Monfared AS, Deevband MR, Amiri M, Gholami A. 2016. Estimating the population dose from nuclear medicine examinations towards establishing diagnostic reference levels. Indian J Nucl Med 31: 31–35. [CrossRef] [PubMed] [Google Scholar]
- Najafi M, Deevband MR, Ahmadi M, Kardan MR. 2015. Establishment of diagnostic reference levels for common multi-detector computed tomography examinations in Iran. Australas Phys Eng Sci Med 38: 603–609. [CrossRef] [PubMed] [Google Scholar]
- National Diagnostic Reference Levels in Japan. 2020. Japan DRLs 2020. (2021) J Natl Radiol Inst. Med. Exp. [Google Scholar]
- Norooz Alizadeh F, Haddad K, Faghihi F. . Investigation and Determination of Diagnostic Radiology Dose Levels in Fars Province and Comparison with International Commission Reference Levels and Other Countries. Iran: Ministry of Science, Research and Technology − Shiraz University − Faculty of Engineering. [Google Scholar]
- Padovani R, et al. 2008. Reference levels at European level for cardiac interventional procedures. Radiat Prot Dosimetry 129: 104–107. [CrossRef] [PubMed] [Google Scholar]
- Peter EM, Garba MA, Silas MA, Ivor CN. 2021. Awareness of cosmic radiation and its hazards amongst air travelers and aviation workers in Mallam Aminu International Airport, Kano, Nigeria. [Google Scholar]
- Rasuli B, Juybari RT, Forouzi M, Ghorbani M. 2017. Patient dose measurement in common medical X-ray examinations and propose the first local dose reference levels to diagnostic radiology in Iran. Polish J Med Phys Eng 23: 67–71. [CrossRef] [Google Scholar]
- Rawashdeh M, Abdelrahman M, Zaitoun M, Saade C, Alewaidat H, McEntee MF. 2019. Diagnostic reference levels for paediatric CT in Jordan. J Radiol Prot 39: 1060. [CrossRef] [PubMed] [Google Scholar]
- Salama DH, et al. 2017. Establishing national diagnostic reference levels (DRLs) for computed tomography in Egypt. Phys Medica 39: 16–24. [CrossRef] [Google Scholar]
- Sohrabi M, Parsi M, Mianji F. 2018. Determination of national diagnostic reference levels in computed tomography examinations of Iran by a new quality control-based dose survey method. Radiat Prot Dosimetry 179: 206–215. [CrossRef] [PubMed] [Google Scholar]
- Tabesh J, Mahdavi M, Haddadi G, Haghighi RR, Jalli R. 2021. Determination of diagnostic reference level (DRL) in common computed tomography examinations with the modified quality control-based dose survey method in four university centers: a comparison of methods. J Biomed Phys Eng 11: 447. [PubMed] [Google Scholar]
- Toori AJ, Shabestani-Monfared A, Deevband MR, Abdi R, Nabahati M. 2015. Dose assessment in computed tomography examination and establishment of local diagnostic reference levels in Mazandaran, Iran. J Biomed Phys Eng 5: 177. [PubMed] [Google Scholar]
- Wall BF, Shrimpton PC. 1998. The historical development of reference doses in diagnostic radiology. Radiat Prot Dosimetry 80: 15–19. [CrossRef] [Google Scholar]
- Zarghani H, Bahreyni M. 2018. Local diagnostic reference levels for some common diagnostic X-ray examinations in Sabzevar County of Iran. Iran J Med Phys 15: 62–65. [Google Scholar]
Cite this article as: Sina S, Kardan MR, Ashtiani HK, Bahreinipour M, Deevband MR, Rakeb Z, Sadeghi MH, Nazari Jahromi MA, Fasaie B, Paydar R, Alizadeh FN, Ghanbarpour MR, Farajzadeh E. 2025. National diagnostic reference levels (DRLs) for general and interventional radiography, mammography, and CT scan based on the latest surveys in Iran. Radioprotection 60(2): 125–133. https://doi.org/10.1051/radiopro/2024047
All Tables
Comparison of DRLs for CTDIvol and DLP in CT imaging, expressed in mGy.cm and mGy.
Comparison of DRLs for Mean Glandular Dose (MGD) in mammography, expressed in mGy.
All Figures
|
Fig. 1 a) map of Iranian provinces. Geographical distribution of b) digital radiology systems, and c) conventional radiology in various provinces in Iran. |
| In the text | |
|
Fig. 2 Geographic distribution of measurements taken for mammography imaging in different provinces. |
| In the text | |
|
Fig. 3 Geographic distribution of measurements taken for abdomen radiology imaging in different provinces. |
| In the text | |
|
Fig. 4 Geographic distribution of measurements taken for abdomen/pelvis CT imaging in different provinces. |
| In the text | |
|
Fig. 5 Distribution of the dose values in different imaging modalities. |
| In the text | |
Current usage metrics show cumulative count of Article Views (full-text article views including HTML views, PDF and ePub downloads, according to the available data) and Abstracts Views on Vision4Press platform.
Data correspond to usage on the plateform after 2015. The current usage metrics is available 48-96 hours after online publication and is updated daily on week days.
Initial download of the metrics may take a while.