")
")
Open Access
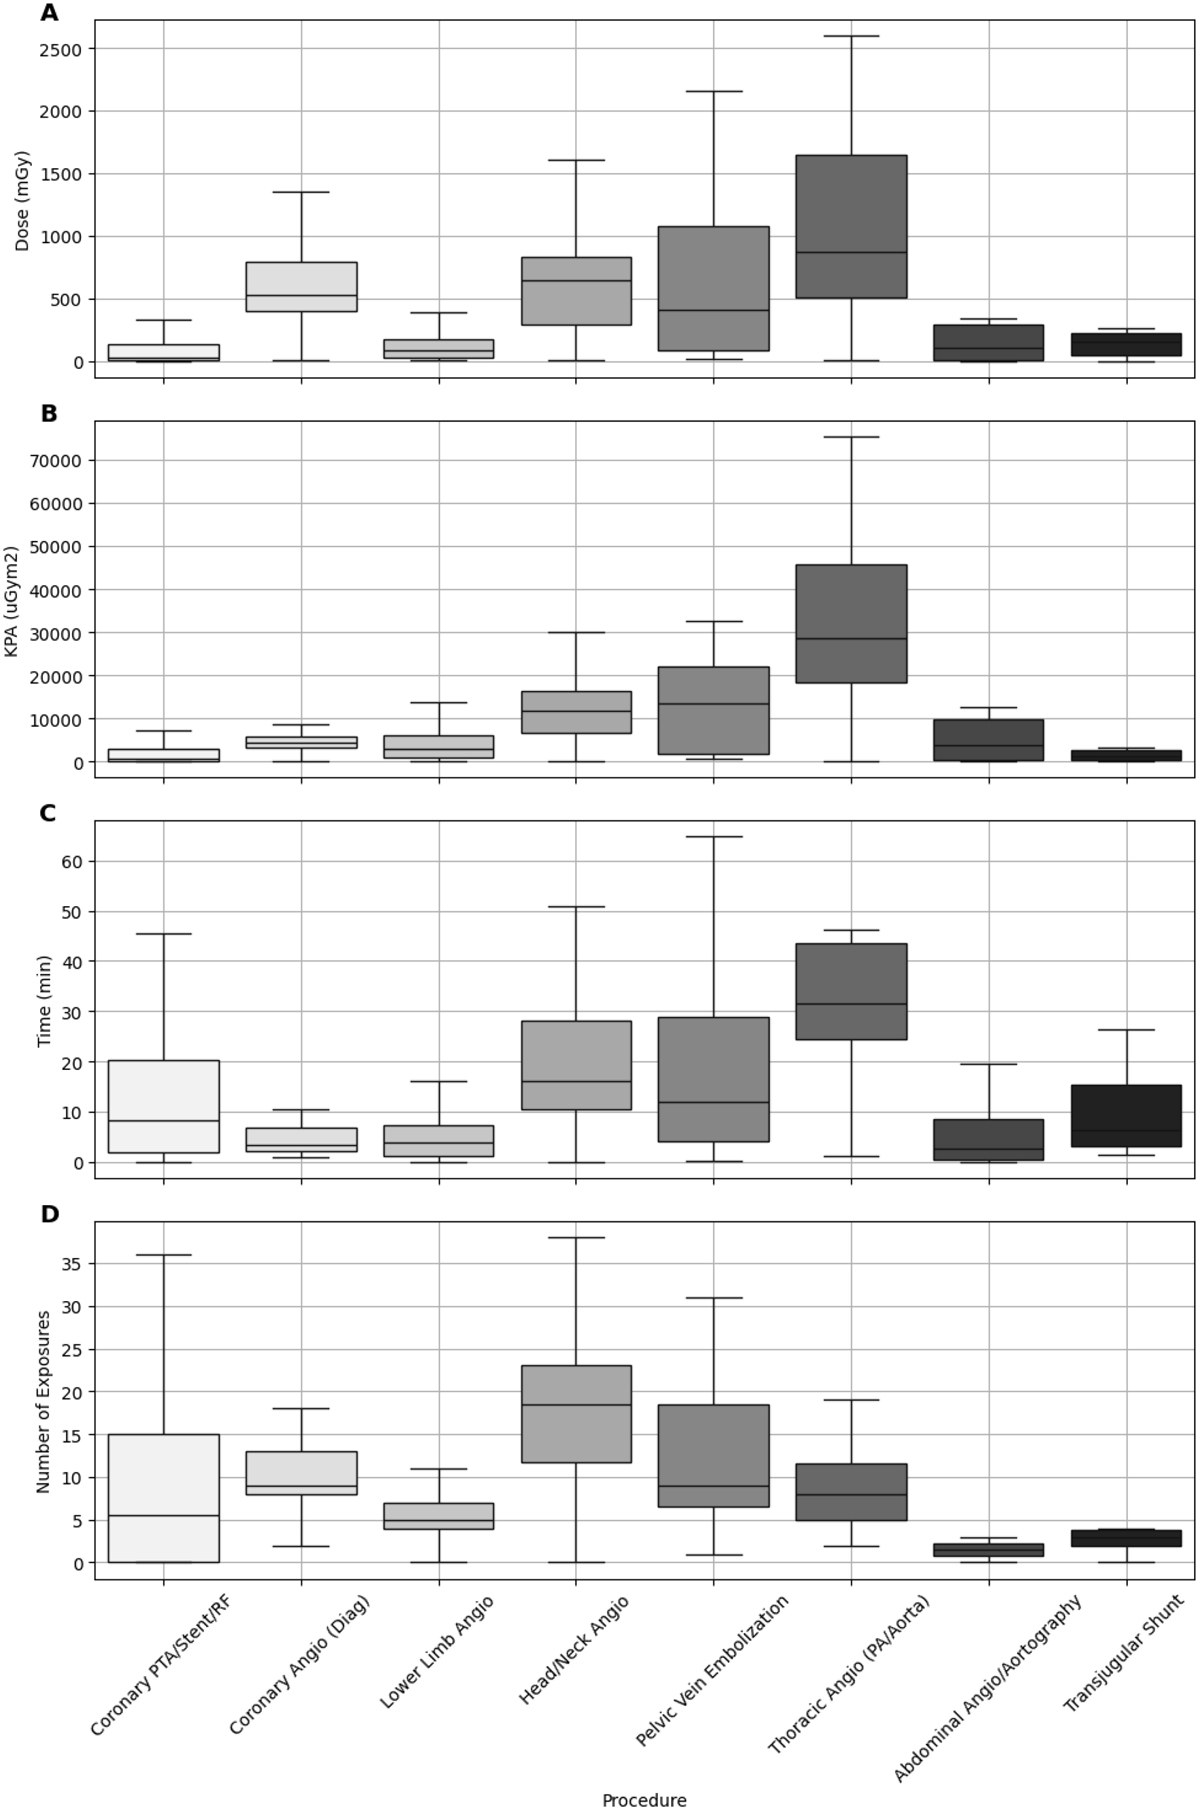
Fig. 3
Download original image
Boxplots represent four measurements from different medical procedures: (A) Dose (in mGy), (B) Kerma-Area Product (KAP in μGym2), (C) Time (min), and (D) Number of Exposures. The procedures are grouped along the x-axis with each boxplot illustrating the distribution of data for each variable.
Current usage metrics show cumulative count of Article Views (full-text article views including HTML views, PDF and ePub downloads, according to the available data) and Abstracts Views on Vision4Press platform.
Data correspond to usage on the plateform after 2015. The current usage metrics is available 48-96 hours after online publication and is updated daily on week days.
Initial download of the metrics may take a while.