")
")
Free Access
Fig. 3
Download original image
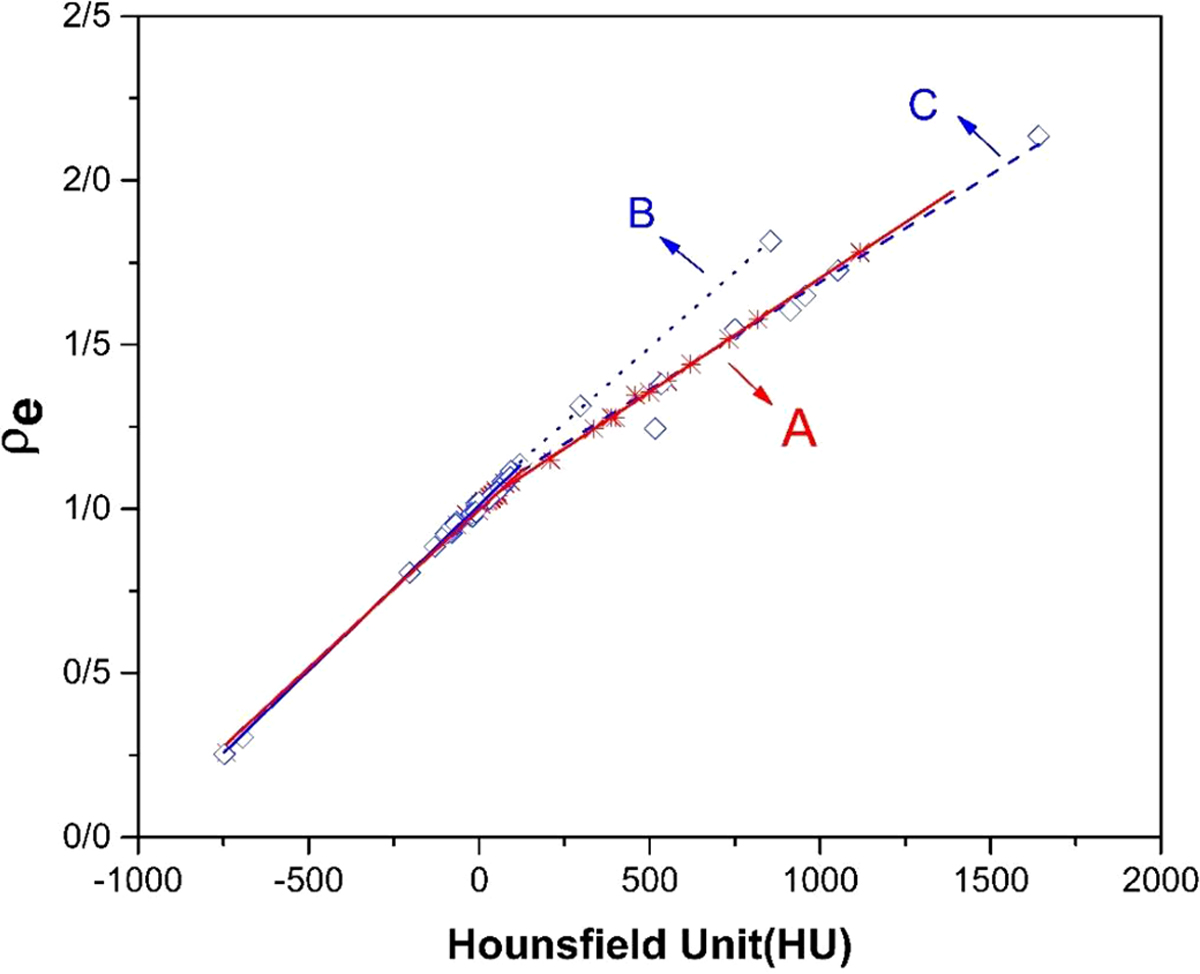
Calibration curves for Siemens SOMATOM Sensation 64-slice CT scanner at tube voltage of 120 kVp. The solid line (A) with star data points results from the stoichiometric method and the dotted and dashed lines (B and C) with squares eventuate from the tissue substitute method.
Current usage metrics show cumulative count of Article Views (full-text article views including HTML views, PDF and ePub downloads, according to the available data) and Abstracts Views on Vision4Press platform.
Data correspond to usage on the plateform after 2015. The current usage metrics is available 48-96 hours after online publication and is updated daily on week days.
Initial download of the metrics may take a while.