")
")
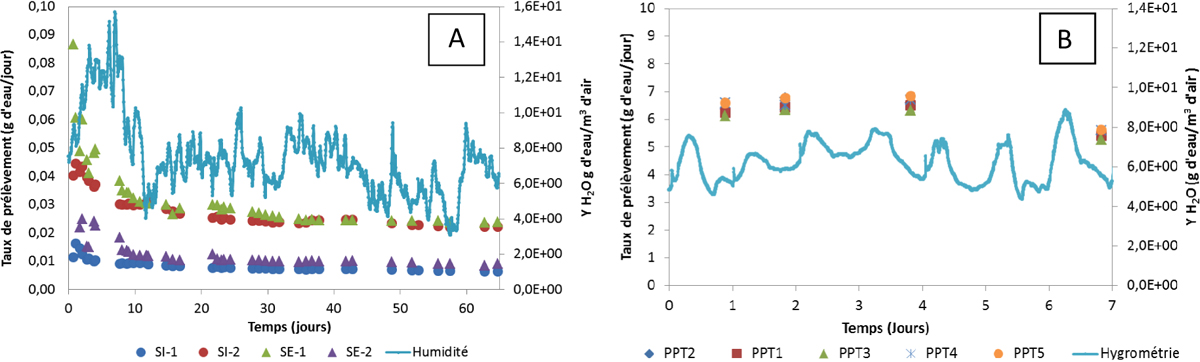
Fig. 5
Download original image
Représentation graphique de la réponse des préleveurs passifs dans l'environnement (SE-1, SE-2, SE-3 représentent des piégeurs avec des taux de prélèvement différents ; PPT1, PPT2, PPT3, PPT4, PPT5 représentent des prélèvements effectués avec le même taux de prélèvement).
Representation of the passive samplers performance in the environment (SE-1, SE-2, SE-3 represents the different passive samplers with different sampling rates; PPT1, PPT2, PPT3, PPT4, PPT5 represents different passive samplers with the same sampling rate).
Current usage metrics show cumulative count of Article Views (full-text article views including HTML views, PDF and ePub downloads, according to the available data) and Abstracts Views on Vision4Press platform.
Data correspond to usage on the plateform after 2015. The current usage metrics is available 48-96 hours after online publication and is updated daily on week days.
Initial download of the metrics may take a while.