


| Issue |
Radioprotection
Volume 61, Number 2, Avril-Juin 2026
|
|
|---|---|---|
| Page(s) | 105 - 112 | |
| DOI | https://doi.org/10.1051/radiopro/2025026 | |
| Published online | 15 juin 2026 | |
Article
Assessment of typical (DRL) values, size-specific dose estimates, organ doses and effective doses of adult patients undergoing computed tomography examinations in a university hospital in Brazzaville, Congo Republic
1
Université Marien Ngouabi, Faculté des Sciences et Techniques, BP 69 Brazzaville, Congo
2
Institut National de Recherche en Sciences Exactes et Naturelles, PB 2400 Brazzaville, Congo
3
Centre Hospitalier Universitaire de Brazzaville, B.P 32 Brazzaville, Congo
4
Direction Générale de la Radioprotection et de la Sûreté Nucléaire, Ministère de l'Energie et des Ressources Hydrauliques, BP 1172 Libreville, Gabon
5
Laboratory of atomic, molecular and Nuclear Physics, Department of Physics, Faculty of Science, University of Yaounde I, P.O. Box 812 Yaounde, Cameroon
* Corresponding author: Cette adresse e-mail est protégée contre les robots spammeurs. Vous devez activer le JavaScript pour la visualiser.
Received:
23
December
2024
Accepted:
7
August
2025
Abstract
This study aimed to assess typical values, size specific dose estimates, organ doses and effective doses of adult patients undergoing computed tomography (CT) examinations in a university hospital in Brazzaville, Congo Republic. The study involved 308 adult patients of which 51% were female patients and 49% were male patients. Median values of the distribution of dose-length product and volume CT dose index for each CT examination type were defined as typical values in agreement with the ICRP publication 135. Size-Specific Dose Estimates were calculated using the American Association of Physicists in Medicine methodology. Organ doses were computed following a methodology that uses dose coefficients and volume CT dose index. Effective doses were derived using the calculated organ dose values and tissue weighting factors given in ICRP publication 103. Typical values, size-specific dose estimates, organ doses and effective doses determined for female patients were greater than those determined for male patients. The study also showed that chest-abdomen-pelvis and abdomen-pelvis scans were associated with the highest effective dose while the head scan was associated with the lowest effective dose. The overall dose values determined in this study were significantly lower than those reported in selected studies reported in the literature.
Key words: Typical values / size-specific dose estimates / organ dose / effective dose / Congo Republic
© J. Bazoma et al., Published by EDP Sciences, 2026
 This is an Open Access article distributed under the terms of the Creative Commons Attribution License (https://creativecommons.org/licenses/by/4.0), which permits unrestricted use, distribution, and reproduction in any medium, provided the original work is properly cited.
1 Introduction
Medical imaging, including computed tomography (CT), has made it possible to explore the interior of the body without opening it. CT has several advantages such as patient management in radiotherapy, and visualization of soft tissues and bony structures (Hussain, 2022). However, this device used for diagnostic purposes emits ionizing radiation (X-rays) which may be hazardous for humans (IAEA, 2018). The popularity of radiological examinations implies an increase in the collective dose of X-rays received by the patients (Gillet, 2018). It is therefore important to regularly measure or estimate patient exposure and to analyze its evolution over time. This is mainly because the probability of radiation induced cancer increases with increasing radiation dose. Measuring or estimating patient dose is particularly necessary to ensure that medical facilities comply with regulations and use safe practices. Furthermore, studies on patient radiation dose provide valuable data for research and development of new medical imaging techniques. They help to evaluate the effectiveness of new technologies and new equipment in order to reduce patient dose while maintaining adequate image quality.
Patient dosimetry is the methodology used to measure or estimate the radiation dose received by patients during radiological procedures. Several radiation dose quantities may be used for this purpose. In CT, the main radiation quantities used are the volume CT Dose Index (CTDIvol, in mGy) and the dose-length product (DLP in mGy.cm) (ICRP, 2017). Diagnostic Reference Levels (DRLs) are usually proposed in terms CTDIvol and DLP. These two quantities are based on standard-size cylindrical phantoms (16-and 32 cm phantoms) and do not take into account patient size apart from the patient scan length which is incorporated in DLP computation. Size-Specific Dose Estimates (SSDE) were developed to address this issue (AAPM, 2011). However, SSDE are not appropriate to estimate organ doses (Boone, 2012; Sahbaee, 2014). Yet, the determination of organ doses (DT, in mGy) is capital as they are required for assessing the probability of cancer induction in exposed individuals (ICRP, 2007). Finally, the effective dose (E, in mSv) is a quantity mainly used to compare radiation doses from different diagnostic procedures and for comparing the use of similar technologies and procedures in different hospitals and countries as well as the use of different technologies for the same medical examination (ICRP, 2007).
At the national level, studies on organ dose estimation (Bazoma, 2022) and on establishment of typical dose reference level values (Dallou, 2024) have been conducted. These studies have shown that, in some cases, the doses delivered to the organs of patients undergoing CT examinations were very high, hence the need to conduct this study based on new equipment with current technology.
The objective of this study was to assess typical (DRL) values, SSDE, organ doses and effective doses of adult patients undergoing CT examinations in a university hospital in Brazzaville, Congo Republic.
2 Material and methods
2.1 Material
This study was carried out using a CT machine of the brand CT Canon (serial number: 4AA2233376) of 80 slices, installed in the service of medical imaging of the university hospital of Brazzaville in the Republic of Congo. The frequency of CT scan examinations is up to 50 patients per week. This CT machine was manufactured in March 2022 and put into service in July 2022.
2.2 Methods
2.2.1 Collection of data
This study is a retrospective study that involved 308 adult patients. The data were manually collected from the console of the CT machine used. The data were collected from September to December 2023. The institutional review boards of the university hospital judged that this research work did not need to obtain patient informed consent. All patient data were anonymized before their evaluation. All data were handled in agreements with the research authorization No. 0378/MSP-CAB/DGAR/DARH/SFS-24 granted by the Ministry of health and population, Republic of Congo, and the research authorization No. 044/MSP/CHUB-DG/DERE/SR-23 granted by the General Directorate of the university hospital of Brazzaville. The information collected was the following: the examination type (head, chest, abdomen-pelvis − AP, chest-abdomen-pelvis − CAP CT scans), age and sex of the patients, the anteroposterior (AP) and lateral (LAT) dimensions of patients, and the machine parameters (kV, mAs, CTDIvol, DLP, pitch, slice thickness, collimation, field of view) associated with the examination.
2.2.2 Statistical analysis
The data collected in this study were analyzed using the softwares Microsoft Office Excel Professional Plus 2013 (Microsoft corporation, USA) and Matlab (The MathWorks, Inc, USA), version R2013a. They were mainly used to plot graphs and compute statistical parameters such as the mean values, standard deviations, quartiles, etc.
2.2.3 Typical values
Since only one CT facility was involved in the present study, the median values of the distribution of DLP and CTDIvol of the head, chest, AP and CAP CT examinations were defined as typical (DRL) values in agreement with the ICRP publication 135 (ICRP, 2017).
2.2.4 Size-specific dose estimates
SSDE were calculated using the following formula (AAPM, 2011):
 (1)
(1)
for the 32 cm diameter reference phantom, used for body examination of adult patients. The superscript D corresponds to the conversion factor  related to effective diameter given in Table 1D of the reference (AAPM, 2011). The effective diameter Deff was calculated through the following formula:
 (2)
(2)
CT techniques used.
2.2.5 Organ and effective doses
A Monte Carlo-based method was used to compute organ and effective doses. Dose coefficients for adult patients were used to convert CTDIvol to organ doses using the following formula (Bazoma, 2022; Lee, 2015):
 (3)
(3)
where DT is the dose to the organ or tissue T and DC (in mGy/mGy) is the CTDIvol −normalized organ absorbed dose coefficient which is a function of the organ of interest, the patient sex, age and size, and the scanner beam quality. DCs used in this study were for 35 years-old adult male and female ICRP reference phantoms. DCs values less than 0.02 mGy/mGy were not provided in the tables and were attributed a value of 0 mGy/mGy in the present work.
Effective doses were computed using the calculated organ dose values and tissue weighting factors given in ICRP publication 103 (ICRP, 2007) according to the following equation:
 (4)
(4)
where  and
and  are equivalent doses (HT = WR × DT, WR = 1 for photons) evaluated for organ or tissue T of the reference male and reference female, respectively. In this study, sex-related equivalent doses (male: prostate and testes; female: uterus, ovaries) were not averaged.
3 Results and discussion
3.1 CT techniques and patient demographics
The CT techniques applied and patient demographics are presented in Tables 1 and 2, respectively. Table 3 shows the statistical comparison between the data collected for female and male patients. A low variation of the kVp is observed for all the types of examinations involved in the study (coefficient of variation, CV, < 7%). Contrarywise, a relatively significant variation of the mAs was observed (from ≈ 7% for head scan to ≈ 41% for chest scan). The variation is even more pronounced for CTDIvol (from ≈ 13% for head scan to ≈ 71% for chest scan) and DLP (from ≈ 11% for head scan to ≈ 69% for AP scan).
As shown in Table 2, the study involved 308 adult patients of which 51% were female patients and 49% were male patients. The age varied from 17 to 96 years with an overall average of 55 years. Examination with the highest number of patients was head scan (65%), and examinations with the lowest number of patients were chest and CAP scans (11%).
Statistical comparison between the data collected for female and male patients is presented in Table 3 below.
Since the p-values are all ≥ α = 0.05, the statistical significance level, therefore the distributions of the data collected (mAs, CTDIvol and DLP) for female and male patients are not statistically different. This means that the data for female and male patients can be combined.
Patient demographics.
Statistical comparison (p-value) between the data collected for female and male patients.
3.2 Typical (DRL) values
Figure 1 shows the distributions of CTDIvol and DLP per examination type. Values considered as abnormal are shown in red points. The range of CTDIvol collected and the computed mean values ± 1 standard deviation were 40.1–57 mGy and 53.5 ± 6.8 mGy, 1.5–15.5 mGy and 3.5 ± 2.5 mGy, 2.2–13 mGy and 3.6 ± 1.8 mGy, 2.2–12.1 mGy and 3.7 ± 2.0 mGy for head, chest, AP and CAP scans, respectively. The range of DLP collected and the calculated mean values ± 1 standard deviation were 488.3–1542.6 mGy cm and 1180.2 ± 131.7 mGy cm, 64–460.3 mGy cm and 166.9 ± 102.2 mGy cm, 98.3–888.6 mGy cm and 195.1 ± 135.3 mGy cm, 134–786.6 mGy cm and 240.7 ± 127.6 mGy cm for head, chest, AP and CAP scans, respectively. Apart from the case of head scan, a large variation (CV range, CTDIvol: 50–71 %, DLP: 53–69 %) in CTDIvol and DLP values was observed.
Tables 4 and 5 present the median and 75th percentile values of the distribution of CTDIvol and DLP per examination type, respectively. It is observed that the values for female patients are greater than those for male patient globally. However, as shown in Table 3, these values are not statistically different from each other. Therefore, the overall median values were considered as typical values, i.e., 57 mGy, 2.7 mGy, 3.2 mGy and 3.2 mGy for head, chest, AP and CAP scans, respectively (CTDIvol). For DLP, the typical values were 1172.2 mGy cm, 158.3 mGy cm, 163.2 mGy cm and 203.6 mGy cm.
It is worth noting that setting DRLs has been shown to be an effective tool for identification of examinations for which optimization of protection should be undertaken (ICRP, 2017). Sindi et al. (2024) has undertaken a study that aimed to evaluate the effect of implementing national diagnostic reference levels for adult chest CT scans at a major Saudi Arabia hospital. They showed that 83.5% of scans passed DRL criteria (CTDIvol = 12 mGy, DLP = 430 mGy cm), with higher pass rates for contrast (91.8%) versus non-contrast (81.5%) scans. Furthermore, they compared effective dose before and after DRL implementation. They showed that, for non-contrast scans, the effective dose declined by 2.43%. For contrast scans, the effective dose declined by 6.77%. It will be of interest to undertake a similar study in Congo that assesses the effect of implementing DRLs in CT installations.
Finally, it is important to stress that in the country there are 15 CT machines in service, of which 8 are located in the capital city Brazzaville. The present study involved only 1 CT machine installed in the largest hospital (the most frequented by patients) in the Republic of Congo. A larger study is needed to provide reference values at the national level. However, the present study provide a first set of reference values for the radiation protection of patients in our country.
 |
Fig. 1 Overall distribution of CTDIvol and DLP per examination type. |
Median and 75th percentile (in mGy) of the distribution of CTDIvol per examination type.
Median and 75th percentile (in mGy cm) of the distribution of DLP per examination type.
3.3 Size-specific dose estimates
Figure 2 shows the distribution of SSDE per examination type for overall patients. Mean SSDE value ± 1 standard deviation for overall patients were 5.2 ± 4.3 mGy (range: 0.52–26.8 mGy; p-value = 0.25), 5.3 ± 2.4 mGy (range: 3.6–18.8 mGy; p-value = 0.11), 5.5 ± 2.7 mGy (range: 3.7–15.9 mGy; p-value = 0.017) for chest, AP and CAP scans. The p-value given characterizes the statistical comparison between the SSDE values for female and male patients. It can be seen that the p-value for CAP scan is < α = 0.05. Thus, for CAP scan, the separate distributions for female and male patients should be considered. Hence, the mean SSDE value ± 1 standard deviation for female and male patients were, respectively, 6.1± 3.2 mGy (range: 3.7–15.9 mGy) and 4.3± 0.4 mGy (range: 3.8–4.9 mGy).
Table 6 presents median and 75th percentile values of the distribution of SSDE per examination type for female, male and overall patients. It is observed that values for female patients were systematically higher than values for male patients. However, as shown above, for chest and AP scan, values for female and male patients are not statistically different.
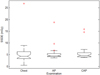 |
Fig. 2 Distribution of SSDE per examination type for overall, female and male patients, respectively. |
Median and 75th percentile (in mGy) of the distribution of SSDE per examination type.
3.4 Organ and effective doses
The details for the estimated doses to organs and tissues for head, chest, AP and CAP scans are not shown here. Table 7 shows mean and median effective doses for head, chest, AP and CAP scans.
For head scan, relevant organs and tissues that received the highest doses were the brain (median dose = 40.9 mGy; p-value = 0), the lens (median dose = 48.5 mGy; p-value = 0.005) and the salivary gland (median dose = 38.4 mGy; p-value = 0). The mean effective dose associated with head scan was 1.4 ± 0.2 mSv (median dose = 1.3 mSv; p-value = 0).
For chest scan, pertinent organs and tissues that received the highest doses were the thymus (median dose = 3.9 mGy; p-value = 0.15), the lungs (median dose = 3.5 mGy; p-value = 0.04), the breast (median dose = 3.3 mGy; p-value = 0.04) and the heart (median dose = 3.7 mGy; p-value = 0.04). The mean effective dose associated with chest scan was 2.3 ± 1.7 mSv (median dose = 1.7 mSv; p-value = 0.09).
For AP scan, organs and tissues that received the highest doses were the stomach, liver, gall bladder, spleen, pancreas, kidney, small intestine and colon. The corresponding median dose range was 4.0–4.9 mGy (p-value: 0.05, 0.06, 0.11 and 0.18 for kidney, gall bladder, colon and small intestine, respectively. The other organs were associated with a p-value < 0.05). The mean effective dose associated with AP scan was 2.8 ± 1.5 mSv (median dose = 2.2 mSv; p-value = 0.03).
For CAP scan, organs and tissues that received the highest doses were the stomach, the liver, gall bladder, spleen, pancreas, kidney, small intestine and colon. For these organs and tissues, the median dose range was 4.2–4.7 mGy (p-values < 0.05). The mean effective dose associated with CAP scan was 2.9 ± 1.7 mSv (median dose = 2.4 mSv; p-value = 0.007).
It is observed that effective doses to female patients are significantly different from effective doses to male patients (p-values < 0.05). This may be due to doses to several major organs (those associated with the highest doses, e.g., head scan: brain, lens and salivary gland; chest scan: lungs, breast and heart; AP scan: stomach, liver and spleen; CAP scan: stomach, liver and gall bladder) for female patients that are statistically different from those of male patients.
Mean and median effective dose (mSv) for head, chest, AP and CAP scans.
3.5 Variation in the data collected
The data collected (mAs, CTDIvol, DLP) and the dose values derived (SSDE, organ dose, effective dose) showed a large variation, particularly for chest, AP and CAP. This may be due to patient size, scan length or other factors such as the equipment used, the experience of staff, the protocols used, the complexity of the procedure (IAEA, 2013). The patient size in this study was determined in terms of effective diameter. The overall patient effective diameter ranged from 19.4 cm to 86.7 cm (CV = 49 %, chest scan), 18.8 cm to 33.0 cm (CV = 11 %, AP scan), 20.1 cm to 29.7 cm (CV = 11 %, CAP scan). The effective diameter range for female patients was 19.4–86.7 cm (CV = 60 %, chest scan), 18.8–33.0 cm (CV = 12 %, AP scan), 20.1 cm to 29.7 cm (CV = 11 %, CAP scan). The effective diameter range for male patients was 20.1–28.6 cm (CV = 12 %, chest scan), 21.9–30.4 cm (CV = 9 %, AP scan), 21.9 cm to 27.8 cm (CV = 7 %, CAP scan). This shows that women patient size contributed significantly in the large variation observed in the data collected and dose values derived, particularly for the case of chest scan. For the DLP values collected, the large variation observed is partly due to scan length, particularly that of female patients. The other causes of the observed variation may be the other factors mentioned above.
3.6 Typical DRL values: comparison with selected studies
As shown in Table 3, the study involved 308 patients distributed as follows: 199, 33, 43, and 33 patients for head, chest, AP, and CAP scans, respectively. These numbers of patients per examination are representative as the International Atomic Energy Agency (IAEA, 2018) recommends a number of patients per procedure of 10–20 for CT. Table 8 compares the typical DRL values determined in this study with DRL values reported in other studies. In the case of DLP, the typical value (1172.2 mGy cm) determined for head scan is greater than DRL values proposed in Congo (637.3 mGy cm) (Dallou, 2024), Nigeria (1044 mGy cm) (Kabeer, 2024) and Lebanon (1104 mGy cm) (Hakme, 2023), but lower than the value determined in Morocco (1405.8 mGy cm) (El Fahssi, 2024). Typical values determined for chest, AP, CAP scans are significantly lower than those established in these studies. Overall, the same trend is observed in Table 8 in the case of CTDIvol.
Comparison of CTDIvol and DLP median values with DRLs reported in other studies.
3.7 Organ and effective doses: comparison with selected studies
In the case of head scan, the brain dose (40.9 mGy), the eye lens dose (48.5 mGy) and the salivary gland dose (38.4 mGy) determined in the present study are lower than those determined in Nigeria (brain dose = 75.4 mGy, eye lens dose = 107.2 mGy) (Etim Ekpo, 2018), and in the USA (brain dose = 49.3 mGy, eye lens dose = 59.9 mGy, salivary gland dose = 45.8 mGy) (Gao, 2020). The effective dose (E = 1.3 mSv) associated with head scan is lower than the value determined in Nigeria (E = 6.6 mSv) (Etim Ekpo, 2018), and in the USA (E = 2.7 mSv) (Gao, 2020), but is greater than the value determined in Iran (E = 0.7 mSv) (Khoramian, 2017).
Concerning chest scan, the lung dose (3.5 mGy) and the breast dose (3.3 mGy) determined in the present study are lower than those determined in Nigeria (lung dose = 18.9 mGy, breast dose = 24.4 mGy) (Etim Ekpo, 2018), in the USA (lung dose = 9.1 mGy, breast dose = 7.3 mGy) (Gao, 2020), and in Iran (lung dose = 9.3 mGy, breast dose = 4.2 mGy) (Khoramian, 2017). The effective dose (E = 1.7 mSv) associated with chest scan is lower than the value determined in Nigeria (E = 8.2 mSv) (Etim Ekpo, 2018), in the USA (E = 5.9 mSv) (Gao, 2020), and in Iran (E = 3.7 mSv) (Khoramian, 2017).
For AP scan, the stomach dose (4.3 mGy), the liver dose (4.2 mGy) and the colon dose (4.9 mGy) determined in this study are lower than those determined in Iran (stomach dose = 9.4 mGy, liver dose = 9.2 mGy) (Khoramian, 2017), and in the USA (stomach dose = 13.1 mGy, liver dose = 17.5 mGy, colon dose = 16.0 mGy) (Gao, 2020). The effective dose (E = 2.2 mSv) associated with AP scan is lower than the value determined in Iran (E = 7.4 mSv) (Khoramian, 2017), and in the USA (E = 8.7 mSv) (Gao, 2020).
Regarding CAP scan, the stomach dose (4.5 mGy), the liver dose (4.3 mGy) and the colon dose (4.9 mGy) determined in this study are lower than those determined in the USA (stomach dose = 15.8 mGy, liver dose = 19.0 mGy, colon dose = 16.3 mGy) (Gao, 2020). The effective dose (E = 2.4 mSv) associated with CAP scan is lower than the value determined in the USA (E = 12.8 mSv) (Gao, 2020).
It is clear that organ and effective doses determined in this study are significantly lower than those reported in the selected studies reported in the literature. This may be due to the fact that this study involved only one CT installation while the selected studies involved several installations with different CT machines and imaging protocols. This study also showed that the CAP and AP scans are associated with the highest effective dose while the head scan is associated with the lowest effective dose.
3.8 Image quality
Application of DRLs is not sufficient for optimization of protection. The diagnostic quality of the corresponding images must also be evaluated (ICRP, 2017). However, it was not possible to evaluate image quality with a normalized protocol. This could be evaluated in a future study.
4 Conclusion
The present paper aimed to assess typical values, size specific dose estimates, organ doses and effective doses of adult patients undergoing CT examinations in a university hospital in Brazzaville, Congo Republic. Overall, a significant variation of the mAs, CTDIvol and DLP collected was observed. Typical values, size specific dose estimates, organ doses and effective doses were computed. For Typical DRL values and SSDE values, it was observed that the values for female patients were not statistically different from those for male patient, globally. The overall dose values determined in this study were clearly lower than those reported in selected studies reported in the literature. The study also showed that the CAP and AP scans were associated with the highest effective dose while the head scan was associated with the lowest effective dose.
Funding
This work has received operational support from Marien Ngouabi university and from the National Research Institute in Exact and Natural Sciences, Republic of Congo.
Conflicts of interest
The authors declare that they have no known competing financial interests or personal relationships that could have appeared to influence the work reported in this paper.
Data availability statement
Research data are stored in our institutional repositories and could be shared upon request.
Author contribution statement
J. Bazoma: Writing - original draft, Data collection, Methodology, Conceptualization. G. B. Dallou: Writing - review & editing, Methodology, Conceptualization. P. Ondo Meye: Writing - review & editing, Methodology, Conceptualization. R. N. Nzambi Mfoutou: Review & editing, Methodology, Conceptualization. R. R. C. Moubakou Diahou: Review & editing, Methodology, Conceptualization. F. R. Moyikoua: Review & editing, Methodology, Conceptualization. C. Bouka Biona: Review & editing, Methodology, Conceptualization.
Ethics approval
All data were handled in agreements with the research authorization No. 0378/MSP-CAB/DGAR/DARH/SFS-24 granted by the Ministry of health and population, Republic of Congo, and the research authorization No. 044/MSP/CHUB-DG/DERE/SR-23 granted by the General Directorate of the university hospital of Brazzaville.
Informed consent
As a retrospective study, the institutional review boards of the university hospital judged that this research work did not need to obtain patient informed consent.
References
- American Association of Physicists in Medicine. 2011. Size-Specific Dose Estimates (SSDE) in Pediatric and Adult Body CT Examinations. AAPM Report No. 204. AAPM. [Google Scholar]
- Bazoma J. 2022. Assessment of organ and effective doses received by adult patients undergoing computed tomography in three hospitals in Brazzaville, Congo Republic. Radiol Phys Technol 15 (4): 379–386. [Google Scholar]
- Boone JM. 2012. Radiation exposure from CT scans: how to close our knowledge gaps, monitor and safeguard exposure − proceedings and recommendations of the radiation dose summit, sponsored by NIBIB, February 24-25, 2011. Radiology 265: 544–554. [Google Scholar]
- Dallou GB. 2024. Establishment of typical dose reference level (DRL) values for adult patients undergoing computed tomography in three hospitals in Brazzaville, Congo Republic. J Multidiscip Appl Nat Sci 4 (2): 262–272. [Google Scholar]
- El Fahssi M. 2024. Patient radiation doses from adult CT examinations at the Souss Massa Regional Hospital. Radioprotection 59 (1): 13–18. [CrossRef] [EDP Sciences] [Google Scholar]
- Etim Ekpo MA. 2018. Patient dose estimation using CT-expo software at two hospitals in north-central Nigeria. South Clin Ist Euras 29 (2): 125–31. [Google Scholar]
- Gao Y. 2020. Patient-specific organ and effective dose estimates in adult oncologic CT. AJR 214: 738–46. [Google Scholar]
- Gillet P. 2018. Validation d’un Dosimètre Patient Temps Réel Basé sur Fibre Optique pour la Tomodensitométrie X à l’aide de Simulations Monte Carlo. Thèse de Doctorat/PhD, Université de Strasbourg. [Google Scholar]
- Hakme M. 2023. Proposed national diagnostic reference levels for computed tomography examinations based on clinical indication, patient gender and size and the use of contrast in Lebanon. Radioprotection 58 (2): 113–121. [CrossRef] [EDP Sciences] [Google Scholar]
- Hussain S. 2022. Modern diagnostic imaging technique applications and risk factors in the medical field: a review. Biomed Res Int 2022: 5164970. [Google Scholar]
- International Atomic Energy Agency. 2013. Dosimetry in Diagnostic Radiology for Paediatric Patients. IAEA Human Health Series No. 24. IAEA. [Google Scholar]
- International Atomic Energy Agency. 2018. Radiation Protection and Safety in Medical Uses of Ionizing Radiation. IAEA Safety Standards. Specific Safety Guide No. SSG-46. IAEA. [Google Scholar]
- International Commission on Radiological Protection. Diagnostic Reference Levels in Medical Imaging. 2017. Annals of the ICRP. ICRP Publication 135. ICRP. [Google Scholar]
- International Commission on Radiological Protection. 2007. The 2007 Recommendations of the International Commission on Radiological Protection. ICRP Publication 103. Annals of the ICRP. ICRP. [Google Scholar]
- Kabeer SM. 2024. Establishment of diagnostic reference level for routine CT scan examination in Sokoto state, Nigeria. Radioprotetion 59 (3): 197–202. [Google Scholar]
- Khoramian D. 2017. Effective and organ doses from common CT examinations in one general hospital in Tehran, Iran. PJMPE 23 (3): 73–79. [Google Scholar]
- Lee C. 2015. NCICT: a computational solution to estimate organ doses for the pediatric and adult patients undergoing CT scans. J Radiol Prot 35: 891–909. [Google Scholar]
- Sahbaee P. 2014. Patient-based estimation of organ dose for a population of 58 adult patients across 13 protocol categories. Med Phys 41: 072104. [Google Scholar]
- Sindi R, Al-Shamrani B, Bana A, et al. 2024. Impact of implementing national diagnostic reference levels on radiation dose optimization in adult chest CT scans: a comparative analysis. Radioprotection 59 (2): 111–116. [Google Scholar]
Cite this article as: Bazoma J, Dallou GB, Ondo Meye P, Nzambi Mfoutou RN, Moubakou Diahou RRC, Moyikoua FR, Bouka Biona C. 2025. Assessment of typical (DRL) values, size-specific dose estimates, organ doses and effective doses of adult patients undergoing computed tomography examinations in a university hospital in Brazzaville, Congo Republic. Radioprotection 61(2): 105–112. https://doi.org/10.1051/radiopro/2025026
All Tables
Statistical comparison (p-value) between the data collected for female and male patients.
Median and 75th percentile (in mGy) of the distribution of CTDIvol per examination type.
Median and 75th percentile (in mGy cm) of the distribution of DLP per examination type.
Median and 75th percentile (in mGy) of the distribution of SSDE per examination type.
All Figures
|
Fig. 1 Overall distribution of CTDIvol and DLP per examination type. |
| In the text | |
|
Fig. 2 Distribution of SSDE per examination type for overall, female and male patients, respectively. |
| In the text | |
Current usage metrics show cumulative count of Article Views (full-text article views including HTML views, PDF and ePub downloads, according to the available data) and Abstracts Views on Vision4Press platform.
Data correspond to usage on the plateform after 2015. The current usage metrics is available 48-96 hours after online publication and is updated daily on week days.
Initial download of the metrics may take a while.