")
")
| Issue |
Radioprotection
Volume 59, Number 4, October - December 2024
|
|
|---|---|---|
| Page(s) | 327 - 337 | |
| DOI | https://doi.org/10.1051/radiopro/2024022 | |
| Published online | 13 December 2024 | |
Article
Assessing optical radiation exposure to opaque incandescent materials by picture analysis − Part 2: from pixel radiance to eye irradiance
Institut national de recherche et de sécurité (INRS), 1, rue du Morvan, CS 60027, 54519 Vandoeuvre-lès-Nancy Cedex, France
* Corresponding author: This email address is being protected from spambots. You need JavaScript enabled to view it.
Received:
31
October
2023
Accepted:
20
June
2024
Abstract
Incandescent materials emit optical radiation that can cause cataracts, especially in industrial processes. This risk must be assessed to help employers choose an effective means of protecting workers. Where possible, this is done by software simulation. Otherwise, near-infrared irradiance must be measured at the worker’s eye. Since radiometers and spectroradiometers are too expensive for most preventers, a novel and virtually free method has been proposed. Using a photograph, it assesses irradiance by summing the irradiance corresponding to each pixel representing the opaque glowing materials in the image. Pixel irradiance is evaluated from the radiance of the colored body whose temperature and emissivity correspond to the pixel color, weighted by the geometric configuration associated with the pixel in the camera perspective. The first principle − converting pixel color to radiance − was the subject of a first paper. This paper presents the second principle: calculating irradiance at the eye from pixel radiance. This method is accurate enough to assess cataract risk, thereby helping employers to protect workers. An easy and inexpensive way to calibrate the camera is under investigation in view to making it widespread.
Key words: infrared radiation / imaging / occupational exposure
© J.M. Deniel, Published by EDP Sciences, 2024
 This is an Open Access article distributed under the terms of the Creative Commons Attribution License (https://creativecommons.org/licenses/by/4.0), which permits unrestricted use, distribution, and reproduction in any medium, provided the original work is properly cited.
1 Introduction
Industrial workers are at risk for skin burns and thermal damage to the retina and to the cornea (cataracts). This is due to visible and infrared optical radiation emitted by incandescent materials, typically in the 800 to 1,300°C range.
The European Union has set occupational daily limits (European Union, 2006) for the average occupational irradiance EIR from infrared radiation (IR). It is expressed in equation (1.1) where E(λ) is the spectral irradiance at the eye.
 (1.1)
(1.1)
Daily EIR limits depend on exposure time t:1.8E4.t−3/4W/m2 if t < 103s, 100 W/m2 otherwise.
As explained in a previous paper (Deniel, 2024), the CatRayon freeware (INRS, 2018) evaluates an exposure situation in the form of risk indices: such an index is the ratio of an exposure in a wavelength range to its daily limit.
Software simulation cannot assess certain exposure situations. In these cases, it is necessary to measure IR irradiance at the worker’s eye, which requires expensive equipment. To avoid this pitfall a novel method has been presented (Deniel, 2024), that is affordable for most preventers.
This method considers a color camera picture as a matrix of pixel colors, where each pixel p corresponds to a direction in space from the camera’s point of view. It is based on two principles shown in the flowchart in Figure 1, explained in the previous and present papers respectively.
The first is illustrated in the right part of Figure 1. It assumes that a colored body with spectral emissivity m(λ) at a given temperature T can represent the radiance of an incandescent opaque material. This B(m,T λ) radiance follows equation (1.2), where h is the Planck constant, c is the speed of light in the vacuum, and k is the Boltzmann constant.
 (1.2)
(1.2)
The previous paper (Deniel, 2024) explains how to convert the color of any pixel p corresponding to a glowing opaque material into a spectral emissivity mp(λ) and a temperature Tp, then into B(m,Tp, λ).
The second principle is illustrated in the left and bottom parts of Figure 1. First, each pixel p is considered as a rectangular window corresponding to a solid angle, which is projected onto the sensor plane as a form factor ffp. The characteristics of the camera perspective are used to compute ffp (also called configuration factor) (Howell et al., 2021).
Then the incident IR irradiance through the solid angle corresponding to pixel p is simply π * ffp * B (mp, Tp, λ).
Finally, EIR is the sum of the irradiance from all pixels corresponding to incandescent materials and not too dark.
As risk indices from exposure to IR usually vary from tens to hundreds, such an estimation does not require the accuracy of radiometry. In such situations, even a ±50% EIR estimation would be useful to obtain information on the risk and lead employers to investigate and prevent workers from being subject to cataracts. This paper presents the use of the ffp geometry terms in order to compute EIR, and the influence of image resolution and noise on EIR appraisal, compared to measured and theoretical irradiance.
 |
Fig. 1 Scheme of cataract risk assessment from an image with incandescent opaque materials. |
2 Materials and method
The equipment to compare the estimated and measured irradiance are exactly the same as that used in (Deniel, 2024). As illustrated in Figure 2, the camera and the spectroradiometer had to be placed close to each other, in front of the INRS furnace.
We had to compare the irradiance measured with the spectroradiometer and the irradiance estimated from camera images taken at the same distance from the optical radiation sources. While measuring the distance from the source opening to the spectroradiometer optics is easy, measuring the distance from sources opening to the camera optical center is not straightforward. Figure 3 shows the arbitrary reference point on the camera body, at which we placed the spectroradiometer optics, at distance Z from the source opening. We determined a Z0 = -7.33 cm distance offset along the camera view axis, between the reference point on the camera body and the opening of a pinhole approximation of the camera lens. We could verify that Z+Z0 successfully matched up the objects seen in the pictures with their virtual projection in the camera perspective.
The far field assumption that irradiance varies as the inverse squared distance, applies when the irradiance distance exceeds 5 times the size of the light source (see DiLaura et al., 2011a Fig. 9-3 p. 389). In the case of our blackbody, error on irradiance will be ± 7% at 97mm, ± 2% at 172mm and neglictible at 492mm. This assumption allowed comparison of the method with the measured irradiances scaled by  .
.
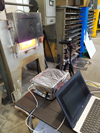 |
Fig. 2 Measurement conditions in front of the INRS metal furnace: in the front, the AvaSpec NIR256-2.5TEC spectroradiometer is protected by a survival blanket; in the rear, its optics and the camera face the furnace opening. Note that a pipe reduces the spectroradiometer measurement field to approximately the furnace opening. |
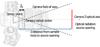 |
Fig. 3 . Z0 distance offset from a reference point on the camera body to the camera optical center. |
2.1 Pixel form factor calculation
The second principle of the proposed method is to sum the IR irradiance of each p pixel, as expressed in equation (2.1).
 (2.1)
(2.1)
This technique is called hemicube in realistic image synthesis (Cohen and Greenberg, 1985) when five planes are considered (see Fig. 4a). In our case, just one plane must be considered; it is called the hemiplane method (Sillion and Puech 1989) (see Fig. 4b).
Considering each pixel p a rectangle, its ffp form factor corresponds to a rectangle-based solid angle ωp as illustrated in Figure 5a.
Several methods can be used to exactly compute ffp (Cohen and Greenberg 1985). We used the straightforward Carre method (Carré, 1998, pp. 67-68) (see Fig. 5b) based on the Nusselt analogy (see Fig. 10.3 in DiLaura et al., 2011b, p. 10.7).
In this method, polygonal surfaces in space are projected on a unitary disc of center O. A polygon is a series of [AB] edges in trigonometric order. The projections of A and B on the unitary sphere are denoted A’ and B’. Then A’ and B’ are projected on the unitary disc as A” and B” respectively. O, A” and B” form a portion of the disc. Its SAB area can be positive or negative, as given in equations (2.2) where  is the normal to sensor and NAB is the normal to the (O,A’,B’) plane.
 (2.2)
(2.2)
Finally, pixel p form factor ffp is the sum of the successive  . For example, in Figure 5, the form factor associated with polygon ABC is
  , while successive edges projected areas are denoted S1, S2 and −S3, such that S = S1 + S2–S3.
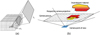 |
Fig. 4 (a) Form factor analogies used in the hemicube - picture from (Cohen and Greenberg 1985) - and (b) the hemiplane (Sillion and Puech 1989) methods. |
 |
Fig. 5 (a) Geometry of the form factor ffp associated with a pixel p in a picture. (b) Carre (Carré 1998) method (picture from this thesis) to compute ffp. |
3 Results
We analyzed pictures of our blackbody and metal furnace, to estimate EIR irradiance. In the same geometrical conditions, at Z distance from the source opening, we measured spectral irradiance. As explained before, it was scaled by  to account for the Z0 distance offset from Z to the camera optical center.
In the first case, the emissivity database was reduced to m(λ)=1. In the second case, it contained all the emissivity data shown in (Deniel, 2024).
3.1 Estimated EIR vs measured irradiance and theoretical blackbody irradiance
In front of our blackbody, we measured Em irradiance in the range [1000; 2500 nm] with the AvaSpec NIR256-2.5TEC and took pictures of the blackbody opening, at three Z distances from it. Em was corrected to account for the Zo distance offset.
In addition, blackbody radiance is assumed to be homogeneous and diffuse. In this case, as explained in (DiLaura et al., 2011b, 10.3.2), and indicated before, the far field approximation allows the simple calculation of Eth irradiance, when the “five times rule” is respected. In this case, the light source can be considered as a point when irradiance distance exceeds 5 times the size of the source. Then, irradiance at distance d varies as inverse squared d, multiplied by the black body intensity that is πr2 times its radiance. This explains the  factor in equation (3.1) below.
For consistency, Eth is limited to the Em wavelength range, as in equation (3.1), while a theoretical EIR,th value is calculated by expanding this equation over [780; 3,000 nm].
 (3.1)
(3.1)
In Table 1,
over [1,000; 2,500 nm], we compare Eth and Em irradiance,
over [780; 3,000 nm], we compare theoretical EIR,th irradiance and estimations by CatRayon( EIR,CR5) and picture analysis (Eth,pic).
Exposure to our blackbody at various Z+Z0 distances: theoretical Eth and measured Em irradiance on [1,000; 2,500nm], and estimated by theory EIR,th and CatRayon EIR,CR5 and camera picture analysis EIR,pc on [780; 3,000nm]. At 800 celsius and 97 and 492 mm measurements failed. At 1,100 celsius and 97 mm the camera and the blackbody were a little misaligned. They were too misaligned at 1,200 celsius and 172 mm.
Comparison of Em measured and EIR estimated irradiance in front of our metal furnace. NB: at 1140 °C, pixels corresponding to the heating coils are overexposed: their red channel is saturated.
3.2 Estimated vs measured irradiance from the metal furnace
As shown in Figure 2 the camera and the optics were positioned next to each other in front of the furnace opening. A pipe reduced the spectroradiometer optics field of measurement to limit Em irradiance from the surrounding. The conditions of measurement and camera shots were those described in (Deniel, 2024).
The furnace opening is not a clear virtual frontier as in the case of the blackbody. That is why we considered the focus distance on the nearest samples inside the furnace. We estimated an irradiance correction factor  between 1.131 and 1.1524.
Table 2 shows the comparison of irradiance between Em measured over [1,000; 2,500 nm] and EIR evaluated by picture analysis over [780; 3,000 nm].
3.3 Picture definition vs irradiance estimation
It is possible to retrieve camera pictures in definitions equal and lower than that of the sensor. This may be advantageous in terms of memory space consumption and the number of pictures retrieved and analyzed per second. However, there is a loss in precision, each pixel being associated with a wider solid angle and hue changing especially along the edges and shape of the items.
We explored definition effects on exposure assessment through EIR difference and the sum of relevant pixel form factors sum in the picture of the 1,000°C furnace. We reduced picture definition from 4640×347px down to 73×55 px by powers of two using Gimp 2.10 software (Spencer Kimball, Peter Mattis, 2021 and The Gnome Project, 2021) and bicubic interpolation (Rowe, 2018).
The results are compared to those of the original picture in Table 3. The difference in evolution between the sum of the form factors and irradiance seems mainly due to pixel color interpolation influencing T temperature and m material estimation.
3.4 Combined effect of picture definition and item silhouette on irradiance estimation
We studied definition effects on the irradiance estimation, in the case where incandescent objects are not massive areas of pixels in the picture. This may be the case of forged pieces for example. Again, we used the 4,640×3,472px picture of our metal furnace at 1,000°C. Black lines were added to this picture to make its silhouette stand out more clearly, as illustrated in Figure 6. In this figure, we show the method result in terms of temperature estimation at various image resolution.
Table 4 should be read like Table 3, for the combined effects of silhouette and resolution. In both tables, a decrease in EIR and Σffp is observed (R2(Σffp; EIR)=0.82): as shown in Figure 6, lower resolution images show dark areas compared to full resolution. Color of pixels in a lower resolution image comes from mixing that of a higher resolution image. Then, (gp/rp ; bp/rp) hue of these p pixels may not match any (mp; Tp) material and temperature in the hue-to-temperature and material precomputed matrix (Deniel, 2024). In this case, these p pixels are ignored in the EIR evaluation. In other case, (gp/rp ; bp/rp) may correspond to (mp; Tp) different from the full resolution image. These phenomena explain the difference between  and EIR at full and lower resolutions in Tables 3 and 4.
 |
Fig. 6 Top: pictures of our metal furnace with black line silhouettes in the highest and lowest resolutions tested in this paper. Bottom: estimated temperatures at various image resolution, in false colors. |
Picture definition effects on the sum of form factors and the irradiance estimation. Only p pixels corresponding to incandescent materials are considered here.
Picture definition effects on form factors and irradiance estimation from cut-out silhouette. Only p pixels corresponding to incandescent materials are considered here.
3.5 Chromatic noise in picture effects on irradiance estimation
Sensor readings are necessarily noisy for several reasons like sensor temperature and analogic-to-digital conversion (Davenport et al., 2012; Zonios, 2010). Cameras can get hot and affordable ones are not cooled. We assume that readout noise influences pixels color, hence the irradiance estimation.
In the case of color cameras, this is called chromatic noise: supernumerary counts appear independently on each pixel color channel and alter its color. We showed in (Deniel, 2024) that each m material at T temperature corresponds to (g/r; b/r) coordinates in precomputed hue-to-exposure, T and m matrices. As chromatic noise will distort these coordinates, picture analysis accounts for the worst case in the ± 0.02 × ± 0.02 matrix area around (g/r; b/r).
To measure the influence of noise on estimated irradiance, we applied the Gimp RGB noise filter (The Gimp project, n.d.) on the 1,000celsius metal furnace picture. Filter parameters are “Independant RGB”, “Linear RGB” and “Gaussian distribution”. The filter level varied from 2% to 20%. Results are given in the left part of Table 5: they consist of the sum of form factors for all relevant pixels and to EIR. In the right part of the table, they are compared to those associated with the original picture.
As shown in the matrix exposed in the previous paper (Deniel, 2024), g/r ∈ [0.39; 0.82] and b/r ∈ [0.05; 0.14]. Any supernumerary count will tend to influence temperature estimation:
on the red channel, it will tend to underestimation,
on the green and blue channel, it will tend to overestimation.
Since the red counts exceed green counts, and green counts exceed blue ones, and b/r range is the narrowest, any supernumerary count will have the highest influence when appearing on the blue channel, then on the green then on the red. Noise appearing equally on the three color channels, it will tend to overestimating material temperature, as shown in Table 5. We can conclude that our method is conservative as chromatic noise tends to overestimate the irradiance to which workers are subjected.
Chromatic noise effect on Σpf fp and EIR estimation. The right columns shows the relative differences with the original picture.
4 Discussion
4.1 Consistency of irradiance between the black body and the method proposed
First, it is important to evaluate the integral difference of irradiance over [780; 3000 nm] (our method) and over [1000; 2500 nm] (measurements). Comparing columns Eth and EIR,th in Table 1 shows that enlarging the wavelength range contributes +28% to +65% to the theoretical irradiance, as illustrated in Figure 7a. In practice, this difference is reduced by strong air CO2 and H2O absorption of [2,500; 3,00 nm] radiations (AMETSOC, 2012), as illustrated in Figure 7b.
Differences in irradiance between columns in Table 1 are given in Table 6. They should be assessed considering:
the gain in irradiance when enlarging the irradiance integration wavelength range,
the loss in irradiance by air absorption, ignored in calculations (Eth, EIR,th, EIR,CR5, EIR,pic).
Second, EIR,CR5 and EIR,th are very close: both are based on the blackbody model, and differ in the numerical integration of form factors.
Third, it appears that measured irradiance Em is under theoretical irradiance EIR,th by −20% to −3.4% (except at 800°C). The first reason is air absorbency, as described before. A second reason is the misalignment of the spectroradiometer and the black body. The third reason is the systematic lowering of the ratio with distance to the black body: the spectroradiometer cosine correction overestimates out of axis irradiance.
Fourth, as stated in Stephan-Boltzman law (Boltzmann, 1884), the total energy radiated by a black body is proportional with T4. What is the influence of εT error on the estimated blackbody temperature, hence on EIR,th, EI,CR5 and EIR,pic ? As these depend on Planck’s integral limited to[1,000; 3,000 nm], they will vary differently from it. For example at Z+Z0 =97 mm, EIR,th and ε IR error on EIR,th due to εT are approximated as follows:
 (4.1)
(4.1)
In Table 6, EIR,th → EIR,pic and εT columns do not show such a relationship. Then, we assume that the difference between EIR,th and EIR,pic mainly comes from geometrical reasons like the Zo value and misalignment.
Generally, irradiance from the blackbody and calculated by picture analysis seems close enough to reality, given the need for accuracy expressed in the introduction.
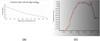 |
Fig. 7 Differences in irradiance from a blackbody: (a) theoretically as a gain by passing from [1,000; 2,500 nm] to [780; 3,000 nm] integral wavelength range, (b) in practice as a loss due to air absorbency above 2,500 nm , as measured in front of a metal melting furnace at 1,200 °C (image from CR5). |
Columns 3 and 4: difference between the observed and the calculated irradiances. Column 5: ∈T error on estimated black body temperature. Column 6: change in EIR,th as a function of ∈T and : misalignment effects.
4.2 Consistency of irradiance between the furnace measurements and the method proposed
The comparison in Table 2 shows that our method is consistent with the measurements performed in front of the metal furnace. As written in introduction, risk indices from IR are usually tens or even hundreds. Despite IR air absorption and the wavelength range difference between Em and EIR, our method is accurate enough to inform on the need to protect against IR and choose the right protection. Nevertheless, a number of observations should be made.
First, the method proposed is sensitive to camera orientation, in the same way as a radiometer. Using a cross in the viewfinder of the camera will help centering the exposure evaluation on objects of interest.
Second, as seen in Table 3, the method proposed underestimates EIR from the cut-out incandescent silhouettes in inverse proportion to the picture definition. Thus, it should capture pictures with the highest definition.
Third, measuring a physical quantity from a device response relies on the established relationship between the two. In our case, sensor linearity to observed radiance is the key. It is absolutely necessary to make pixel levels proportional with exposure time and the observed radiance. The first part of the solution consists in bracketing (Halford, 2022) and analyzing only pixel colors whose all channels lie within the sensor’s linearity range. For example, CCD sensors are known to be linear with observed radiance within [5%; 90%] of their maximum value. This means [13; 229] counts for 8-bit sensors, [205; 3,686] counts for 12-bit sensors. The second part of the solution is to avoid picture treatments, by using RAW picture data. Indeed, pictures at least undergo color balance or white balance (Ramanath and Drew, 2014) and gamma correction (Smith, 1995). Additional treatments tend to enhance pictures, especially in smartphones.
5 Conclusion
The proposed color picture analysis method estimates irradiance from incandescent opaque materials on [780; 3,000 nm]. Our results show that the method is accurate enough to provide information about the risks for workers of being exposed to incandescent materials and to help employers prevent risks of cataract.
This method requires a device already present in the pocket of every preventer, making it virtually free. This may help to prevention from cataracts in various industrial sectors.
Several perspectives are currently planned to make this method genuinely usable in industry. For the method to become available on smartphones, the following conditions are essential:
The camera requires an easy and cheap calibration method. This is currently under investigation.
To ensure proper geometry conditions, especially in smartphones, the method should account for more complex lens models (Kolb et al., 1995) than a pinhole (Tomasi, 2015).
It must be usable with sensors having a low dynamic range, for example through the use of bracketing techniques (Halford, 2022).
In addition, the method’s usability will be improved by reduced assessment time. Currently, analyzing a single picture requires up to 20s on a laptop computer. As described in this paper, the method performs simple operations on matrices. Massively parallel computing by GPGPU (Tarditi et al., 2006) seems the perfect way to process these data in graphic cards and achieve real time processing. In addition to ease of use, this technique may make it possible to assess exposure at any moment over a period of time. This is necessary to estimate doses of irradiance during some steps of an industrial process (i.e., loading a furnace or forging a piece of metal).
Lastly, it is interesting to investigate irradiance estimation using incandescent glass picture analysis. Colored bodies cannot represent incandescent glass for the following reasons:
glass is glossy and even specular; it is not a perfect absorber;
light is not only emitted from surfaces, but from everywhere inside;
the temperature gradient from within a material to its surface will change the intensity and the spectral distribution of the radiations emitted;
it is a both transparent and participatory medium.
Therefore, incandescent glass will need further investigation in terms of modeling and recognition, to protect workers in the glass industry.
Funding
This research did not receive any specific funding.
Conflicts of interest
The author declares that he has no conflict of interest.
Data availability statement
Data associated with this paper can be accessed under DOI : DOI 10.17605/OSF.IO/VGFWK at the following address : https://osf.io/vgfwk/
This data are available under Creative Commons Attribution 4.0 International Public License.
References
- AMETSOC. 2012. Atmospheric Window - Glossary of Meteorology, 2012. https://glossary.ametsoc.org/wiki/Atmospheric_window. [Google Scholar]
- Boltzmann L. 1884. Ableitung des stefan’schen gesetzes, betreffend die abhängigkeit der wärmestrahlung von der temperatur aus der electromagnetischen lichttheorie. Annalen Der Physik 258(6): 291–94. https://doi.org/10.1002/andp.18842580616 [CrossRef] [Google Scholar]
- Carré S. 1998. Outil de Conception Architecturale Pour l’éclairage Naturel/Artificiel. Application de La Synthèse d’image Pour La Prise En Compte Des Notions de Confort et d’ergonomie Visuels. Rennes 1. http://www.theses.fr/1998REN10129 [Google Scholar]
- Cohen MF, Donald PG. 1985. The hemi-cube: a radiosity solution for complex environments. In: Proceedings of the 12th Annual Conference on Computer Graphics and Interactive Techniques, 31–40. SIGGRAPH ’85. New York, NY, USA: ACM. https://doi.org/10.1145/325334.325171 [Google Scholar]
- Davenport JJ, Hodgkinson J, Saffell JR, Tatam RP. 2012. Noise analysis of a CCD based ultra-violet spectrometry system. In: Proceedings of SPIE. Vol. 8439. Optical Sensing and Detection II. https:// doi.org/10.1117/12.922328 [Google Scholar]
- Deniel JM. 2024. Assessing optical radiation exposure to opaque incandescent materials by picture analysis – part 1: from pixel color to radiance. Radioprotection, February. https://doi.org/10.1051/radiopro/2024006 [Google Scholar]
- DiLaura D, Houser KW, Mistrick RG, and Steff GR. 2011a. Chap 9 - lighting calculations. In: Lighting Handbook, 10 ed., pp. 383–444. New York, NY: Illuminating Engineering Society of North America. http://www.ies.org [Google Scholar]
- DiLaura D, Houser KW, Mistrick RG, and Steff GR. 2011b. The Lighting Handbook: Reference and Application. 10. ed. New York, NY: Illuminating Engineering Society of North America. http://www.ies.org [Google Scholar]
- European Union. 2006. Directive 2006/25/EC of the European parliament and of the council of 5 April 2006 on minimum health and safety requirements regarding the exposure of workers to risks arising from physical agents (artificial optical radiation). JOUE L 114/38 Du 27 Avril 2006., April 27, 2006, sec. n° L 114. [Google Scholar]
- Halford E. 2022. Bracketing in Photography: The Ultimate Guide. Digital Photography School. January 31, 2022. https://digital-photography-school.com/?p=13049 [Google Scholar]
- Howell JR, Pinar Mengüç M, Kyle JD, Robert S. 2021. Thermal Radiation Heat Transfer. Seventh edition. Boca Raton: CRC Press. [Google Scholar]
- INRS. 2018. CatRayon 5, logiciel d’évaluation de l’exposition aux rayonnements optiques dans les locaux de travail. http://www.inrs.fr/media.html?refINRS=outil03 [Google Scholar]
- Kolb C, Don M, Pat H. 1995. A realistic camera model for computer graphics. In: Proceedings of the 22nd Annual Conference on Computer Graphics and Interactive Techniques, pp. 317–324. SIGGRAPH ’95.New York, NY, USA: Association for Computing Machinery. https://doi.org/10.1145/218380.218463 [Google Scholar]
- Ramanath R, Mark SD. 2014. White balance. In: Computer Vision: A Reference Guide, edited by Katsushi Ikeuchi, pp. 885–88. Boston, MA: Springer US. https://doi.org/10.1007/978-0-387-31439-6_467 [CrossRef] [Google Scholar]
- Rowe DB. 2018. Bilinear, bicubic, and in between spline interpolation. Course, Department of Mathematics, Statistics, and Computer Science Marquette University, February 15. https://www.mssc.mu.edu/daniel/pubs/RoweTalkMSCS_BiCubic.pdf [Google Scholar]
- Sillion F, Claude P. 1989. A general two-pass method integrating specular and diffuse reflection. Proc SIGGRAPH ’89; 23 (July). https://doi.org/10.1145/74333.74368 [Google Scholar]
- Smith AR. 1995. Gamma Correction Technical Memo 9. September, 5. https://www.academia.edu/73492184/Gamma_Correction_Technical_Memo_9 [Google Scholar]
- Spencer K, Peter M, 2021 The Gnome Project. 2021. GIMP. GIMP The GNU Image Manipulation Program. December 26, 2021. https://www.gimp.org/ [Google Scholar]
- Tarditi D, Sidd P, Jose O. 2006. Accelerator: using data parallelism to program GPUs for general-purpose uses. ACM SIGARCH Comput Archit News 34(5): 325–335. https://doi.org/10.1145/1168919.1168898 [CrossRef] [Google Scholar]
- The Gimp project. n.d. 7.6. RGB Noise. https://docs.gimp.org/2.10/en/gimp-filter-noise-rgb.html [Google Scholar]
- Tomasi C. 2015. A simple camera model. https://api.semanticscholar.org/CorpusID:8708289 [Google Scholar]
- Union Européenne. 2006. Directive 2006/25/CE, Prescriptions Minimales de Sécurité et de Santé Relatives à l’exposition Des Travailleurs Aux Risques Dus Aux Agents Physiques (Rayonnements Optiques Artificiels). JOUE L 114/38 Du 27 Avril 2006., April 27, 2006, sec. n° L 114. [Google Scholar]
- Zonios G. 2010. Noise and stray light characterization of a compact CCD spectrophotometer used in biomedical applications. Appl Opt 49(2): 163–169. [CrossRef] [PubMed] [Google Scholar]
Cite this article as: Deniel JM. 2024. Assessing optical radiation exposure to opaque incandescent materials by picture analysis − Part 2: from pixel radiance to eye irradiance. Radioprotection 59(4): 327–337
All Tables
Exposure to our blackbody at various Z+Z0 distances: theoretical Eth and measured Em irradiance on [1,000; 2,500nm], and estimated by theory EIR,th and CatRayon EIR,CR5 and camera picture analysis EIR,pc on [780; 3,000nm]. At 800 celsius and 97 and 492 mm measurements failed. At 1,100 celsius and 97 mm the camera and the blackbody were a little misaligned. They were too misaligned at 1,200 celsius and 172 mm.
Comparison of Em measured and EIR estimated irradiance in front of our metal furnace. NB: at 1140 °C, pixels corresponding to the heating coils are overexposed: their red channel is saturated.
Picture definition effects on the sum of form factors and the irradiance estimation. Only p pixels corresponding to incandescent materials are considered here.
Picture definition effects on form factors and irradiance estimation from cut-out silhouette. Only p pixels corresponding to incandescent materials are considered here.
Chromatic noise effect on Σpf fp and EIR estimation. The right columns shows the relative differences with the original picture.
Columns 3 and 4: difference between the observed and the calculated irradiances. Column 5: ∈T error on estimated black body temperature. Column 6: change in EIR,th as a function of ∈T and : misalignment effects.
All Figures
|
Fig. 1 Scheme of cataract risk assessment from an image with incandescent opaque materials. |
| In the text | |
|
Fig. 2 Measurement conditions in front of the INRS metal furnace: in the front, the AvaSpec NIR256-2.5TEC spectroradiometer is protected by a survival blanket; in the rear, its optics and the camera face the furnace opening. Note that a pipe reduces the spectroradiometer measurement field to approximately the furnace opening. |
| In the text | |
|
Fig. 3 . Z0 distance offset from a reference point on the camera body to the camera optical center. |
| In the text | |
|
Fig. 4 (a) Form factor analogies used in the hemicube - picture from (Cohen and Greenberg 1985) - and (b) the hemiplane (Sillion and Puech 1989) methods. |
| In the text | |
|
Fig. 5 (a) Geometry of the form factor ffp associated with a pixel p in a picture. (b) Carre (Carré 1998) method (picture from this thesis) to compute ffp. |
| In the text | |
|
Fig. 6 Top: pictures of our metal furnace with black line silhouettes in the highest and lowest resolutions tested in this paper. Bottom: estimated temperatures at various image resolution, in false colors. |
| In the text | |
|
Fig. 7 Differences in irradiance from a blackbody: (a) theoretically as a gain by passing from [1,000; 2,500 nm] to [780; 3,000 nm] integral wavelength range, (b) in practice as a loss due to air absorbency above 2,500 nm , as measured in front of a metal melting furnace at 1,200 °C (image from CR5). |
| In the text | |
Current usage metrics show cumulative count of Article Views (full-text article views including HTML views, PDF and ePub downloads, according to the available data) and Abstracts Views on Vision4Press platform.
Data correspond to usage on the plateform after 2015. The current usage metrics is available 48-96 hours after online publication and is updated daily on week days.
Initial download of the metrics may take a while.