")
")
Open Access
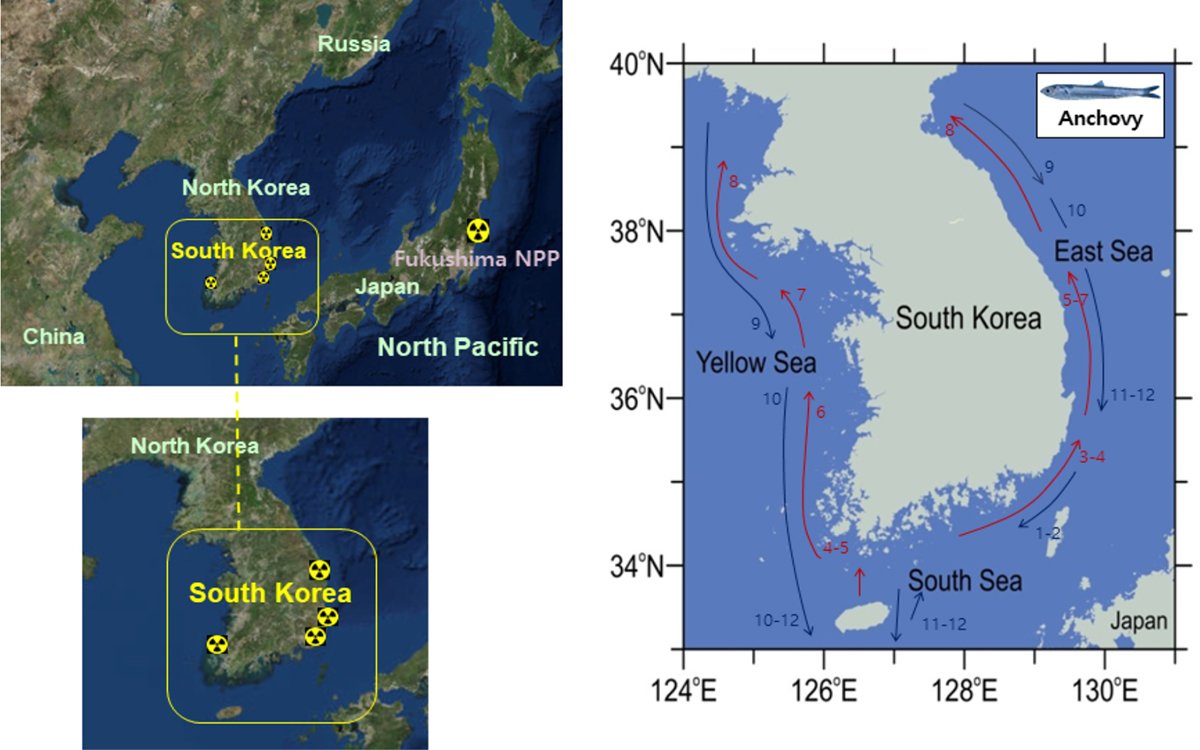
Fig. 1
Download original image
The Korean seas, sampling region (yellow box), and locations of nuclear power plant facilities in South Korea (left). The migratory map of anchovy (right) around the Korean Peninsula. Arrows denote the direction of migration and the numbers denote the date (month) corresponding to the migration route of anchovy.
Current usage metrics show cumulative count of Article Views (full-text article views including HTML views, PDF and ePub downloads, according to the available data) and Abstracts Views on Vision4Press platform.
Data correspond to usage on the plateform after 2015. The current usage metrics is available 48-96 hours after online publication and is updated daily on week days.
Initial download of the metrics may take a while.