")
")
Open Access
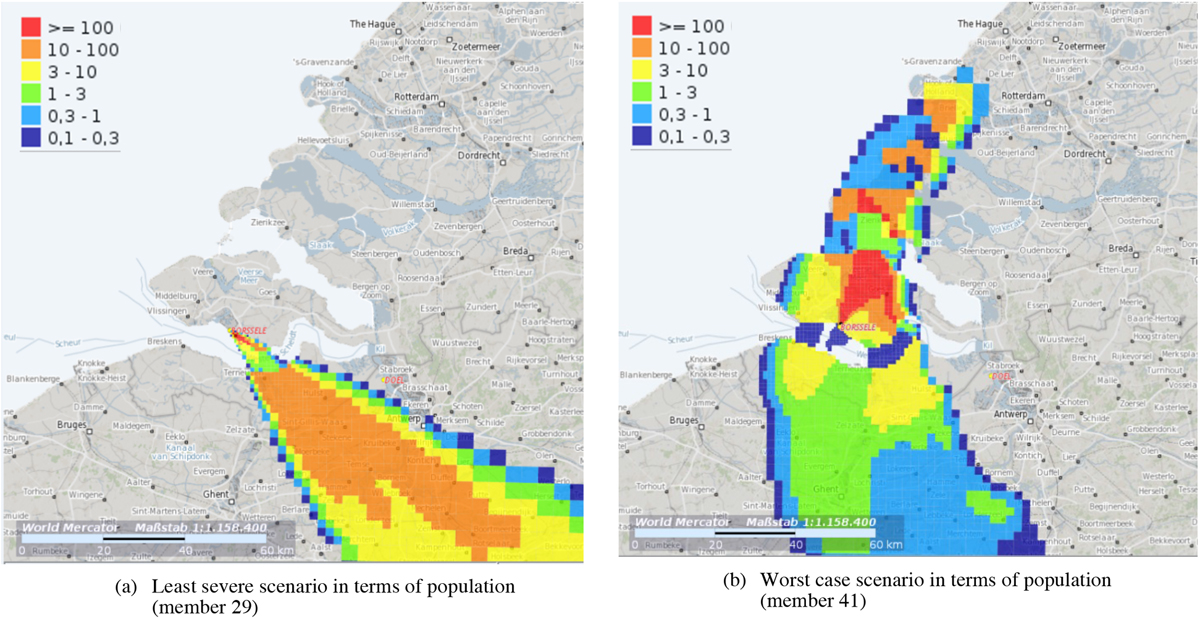
Fig. 8
Download original image
Maps of effective dose for (a) the “least severe” and (b) the “worst case” scenarios in terms of population affected by the threshold exceedance. The first item in the legend (red colour) corresponds to evacuation and the second item in legend (orange colour) to sheltering criterion.
Current usage metrics show cumulative count of Article Views (full-text article views including HTML views, PDF and ePub downloads, according to the available data) and Abstracts Views on Vision4Press platform.
Data correspond to usage on the plateform after 2015. The current usage metrics is available 48-96 hours after online publication and is updated daily on week days.
Initial download of the metrics may take a while.